
Figure 2. ERα expression correlates with proliferation in PTEN-deficient prostate cancer.
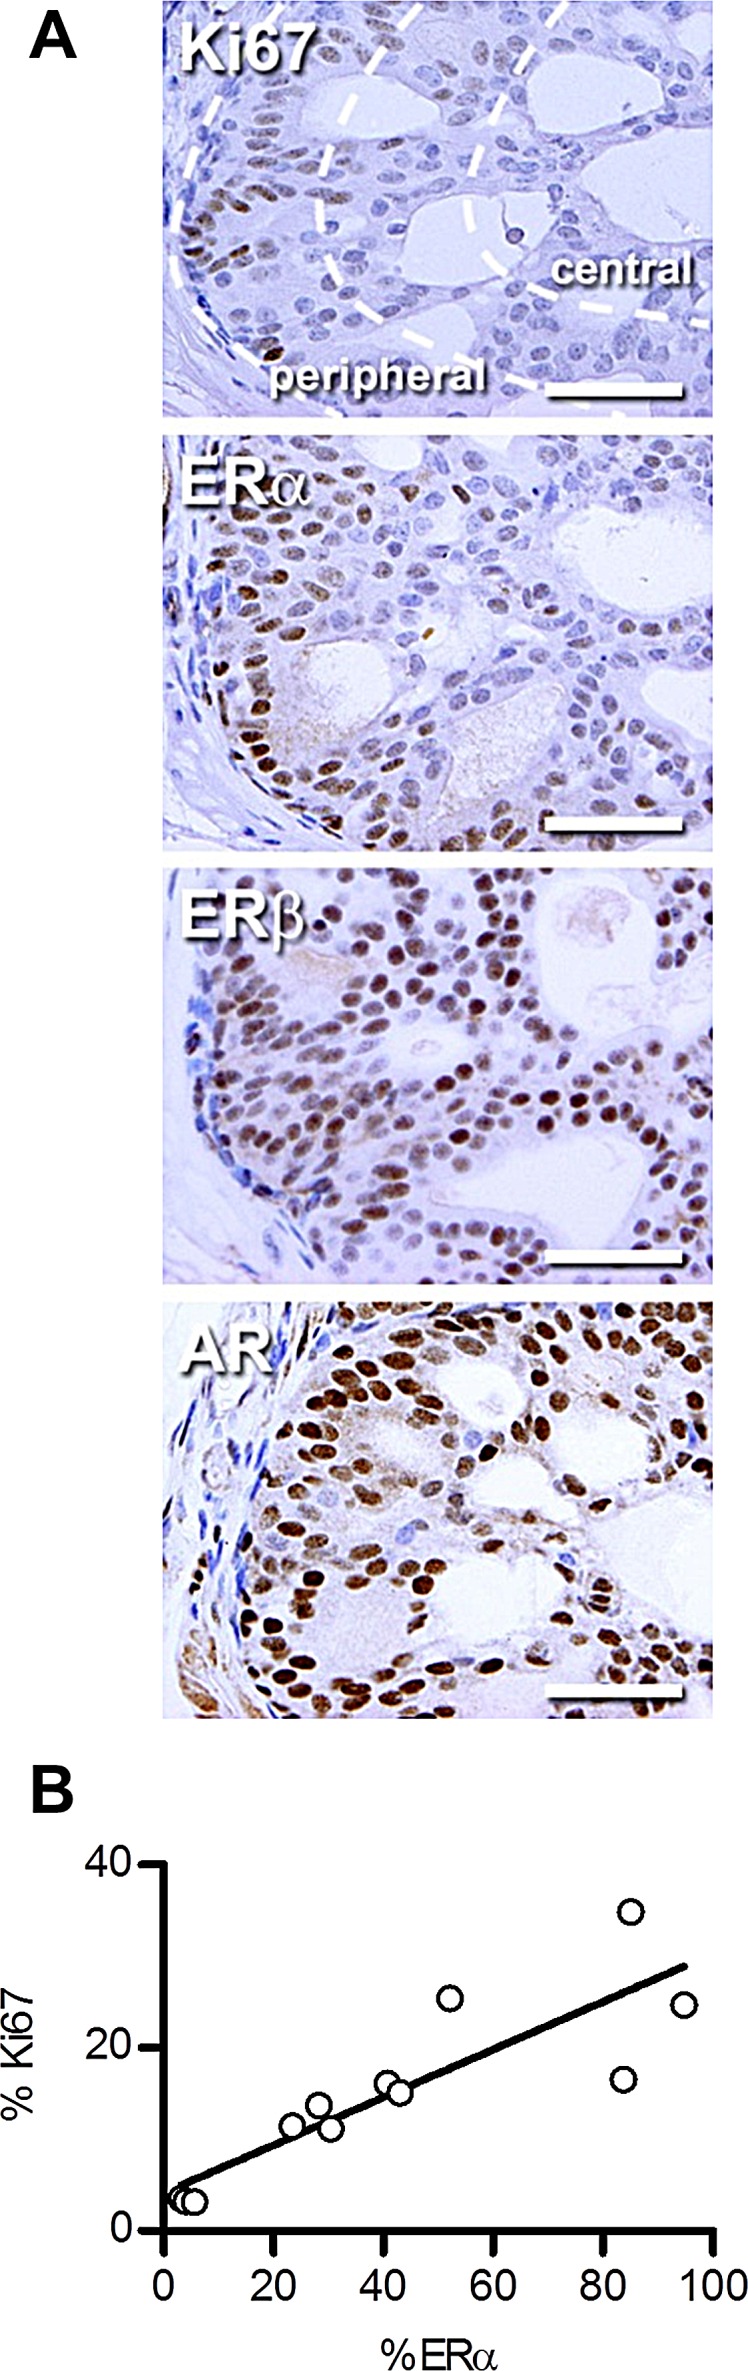
(A) Representative images of immunohistochemical staining of Ki67, ERα, ERβ and AR in the anterior prostate of 12-14 week old PTEN-deficient mice. The peripheral and central regions of the foci are shown in the Ki67 image. Scale bars = 50 μm. (B) Dot plot comparing the percentage of ERα and Ki67 positive cells in the prostate of PTEN-deficient mice (P<0.001, r2=0.75, Pearson correlation, n=12 regions from 3 mice).