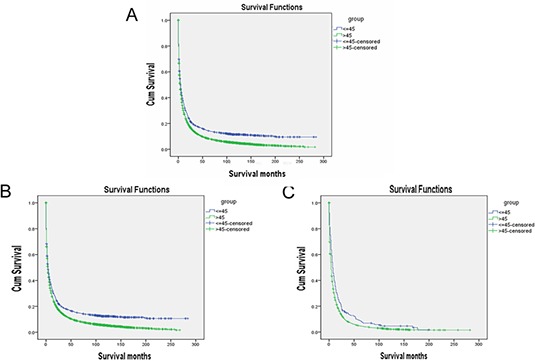
Figure 1. Survival curves in patients according to age status.

LC patients: Young group vs. Elderly group, χ2 = 85.221, P < 0.001, HCC patients: Young group vs. Elderly group, χ2 = 69.408, P < 0.001, ICC patients: Young group vs. Elderly group, χ2 = 16.883, P < 0.001
