
Figure 3. Phenotypic changes in exosome-differentiated BM-MSCs.
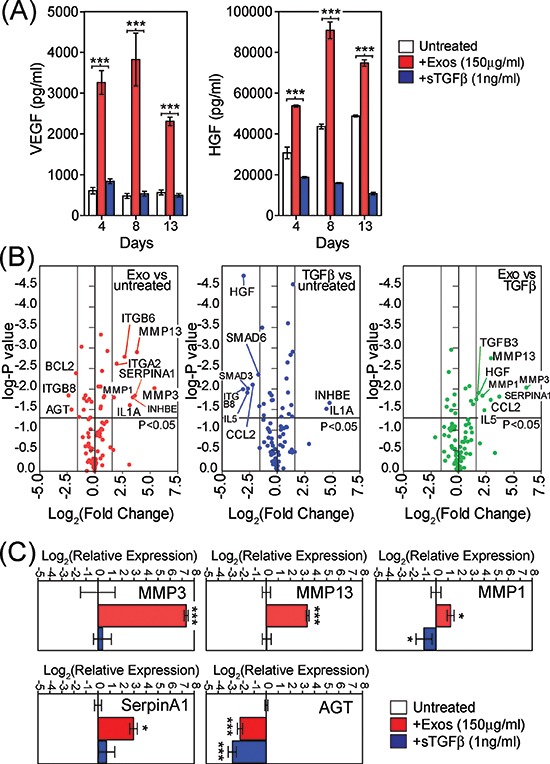
Conditioned media taken from BM-MSC treated with exosomes (150 μg/ml) or sTGFβ1 (1ng/ml) at specified time points, were analysed by ELISA for levels of VEGF (left) or HGF(right) (A). Volcano plot, depicting results from RT2-Profiler™ fibrosis array comparing day4 untreated BM-MSC with exosome-treated MSC (B, left) or with sTGFβ treated exosomes (B, middle) or exosome-treatment vs sTGFβ treatment (B, right). Applied thresholds were a fold change of ± 3 and a p-value of ≤0.05 (t-test based on biological triplicates per treatment) (B). TaqMan-PCR verification of selected transcripts identified by the array, revealing reproducible and significant changes in relative mRNA with GAPDH as an internal standard, at day 4. Columns represent Log2(relative expression) ± SD, compared to untreated BM-MSC (based on biological triplicates) (C).