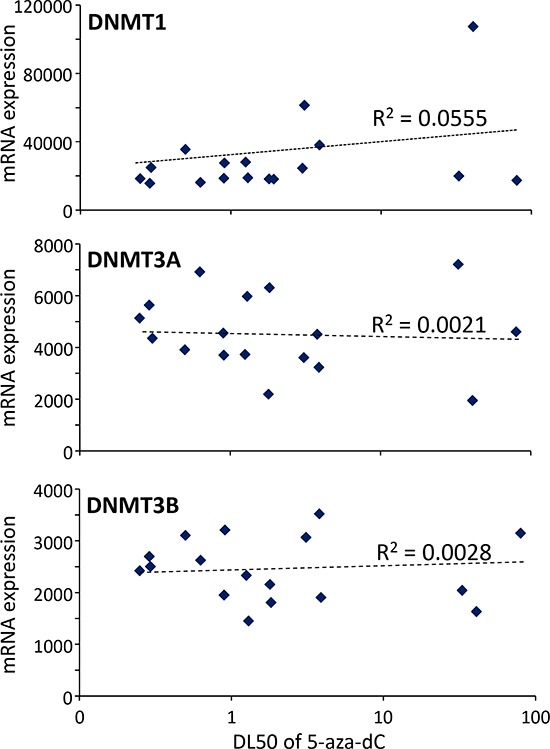
Figure 3. Correlation between sensitivity of the 5-aza-dC and expression of DNMT1, DNMT3A and DNMT3B transcripts.

DL50 of 5-aza-dC was calculated for each xenograft-derived cell and correlated with expression of DNMT1, DNMT3A and DNMT3B mRNAs. r2 is the correlation coefficient.
