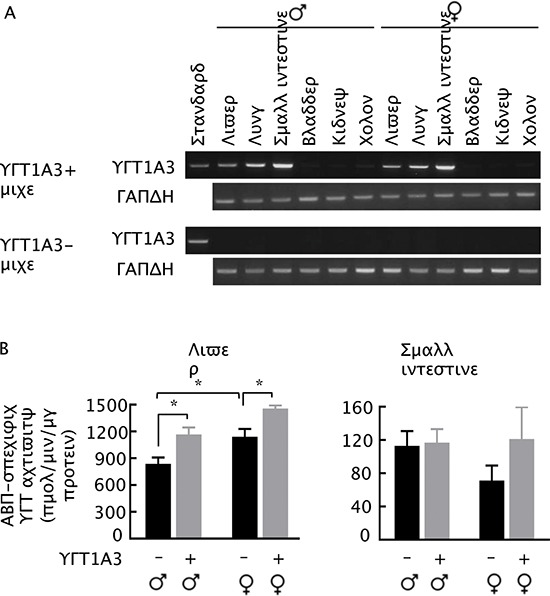
Figure 3. UGT1A3 expression in homozygous UGT1A3 transgenic mice (UGT1A3+).

(A) RT-PCR analysis of UGT1A3 in various organs of UGT1A3+ mice at 7–8 weeks of age, using age-matched non-transgenic mice (UGT1A3-) as control. (B) ABP-specific UGT activity in organs of UGT1A3+ mice and UGT1A3- mice at 7–8 weeks of age. Each value is mean + SE (n = 3) *P < 0.05.
