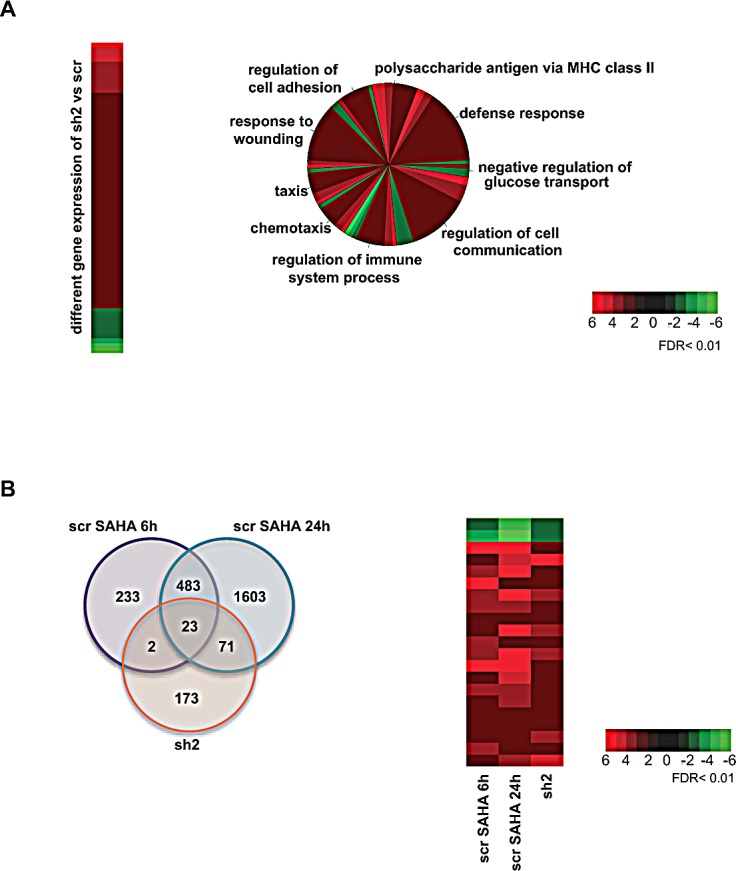
Figure 3. Gene expression profile.

A. Left panel: Microarray heat map of the 269 differentially expressed genes upon HDAC2 silencing with FDR <0.01 and fold change >2. Right panel: Pie chart showing biological processes based on Gene Ontology terms of the 269 differentially expressed genes upon HDAC2 silencing. For each gene associated with the biological processes, fold change abundance was represented by a different color gradient: red indicates upregulation; green indicates downregulation. B. Left panel: Venn diagram of the intersection between differentially expressed genes upon 6 and 24 hours SAHA treatment and HDAC2 silencing with FDR <0.01 and fold change >2. Similarly regulated genes are shown in red. Right panel: Heat map showing the expression fold change of the 23 genes in common upon 6 and 24 hours SAHA treatment and in untreated HDAC2-silenced cells: red indicates upregulation; green indicates downregulation.
