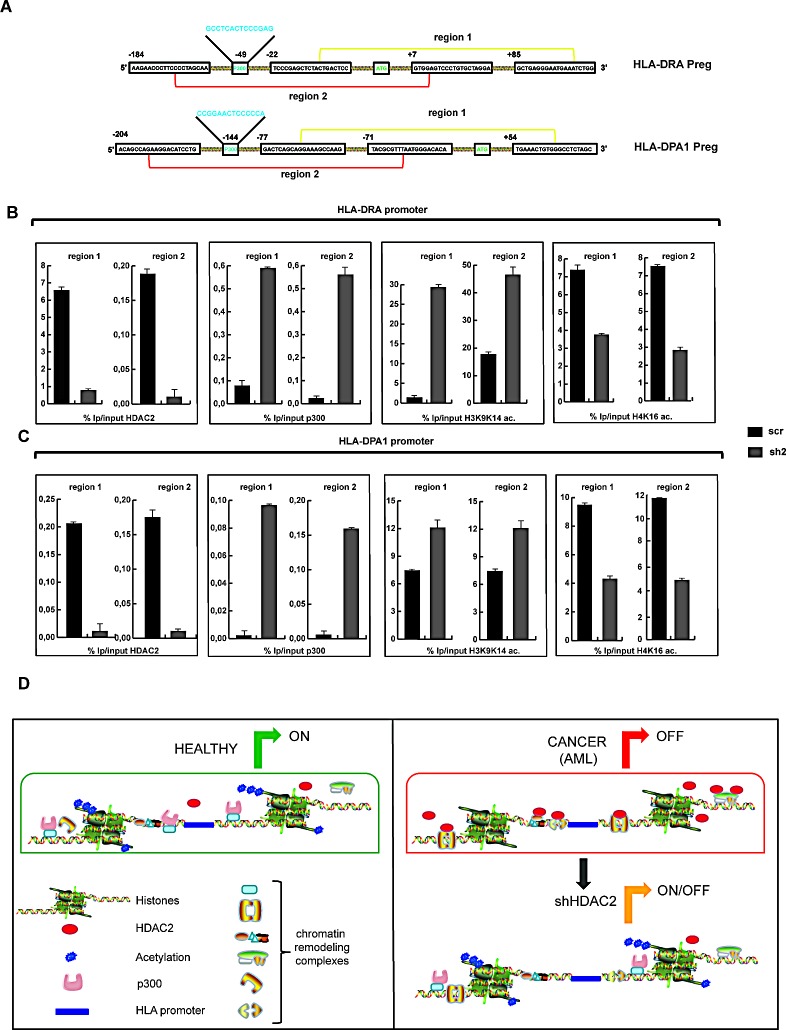
Figure 6. Promoter regions of HLA-DRA and HLA-DPA1 genes.
A. Schematic representation of HLA-DRA and HLA-DPA1 gene promoter regions. Region 1 (yellow) represents the part of the promoter which includes ATG region. Region 2 (red) represents the part of the promoter including a motif that recognizes p300. B. ChIP assays on HLA-DRA promoter in regions 1 and 2 after immunoprecipitation of sh2 and scr clones with HDAC2, p300, acetylated histone H3K9K14 and acetylated histone H4K16. C. ChIP assays on HLA-DPA1 promoter in regions 1 and 2 after immunoprecipitation of sh2 and scr clones with HDAC2, p300 and acetylated histone H3K9K14. D. Schematic model representing HDAC2 mechanism in AML cells. Left panel: In healthy conditions, transcriptional machinery is active due to highly acetylated status of chromatin and low occupancy of HDAC2. Right panel: In AML, transcription is ‘off’, due to high occupancy of HDAC2 and absence of acetylation. In sh2 clone, transcription is activated by restoring very similar conditions compared to healthy state.

