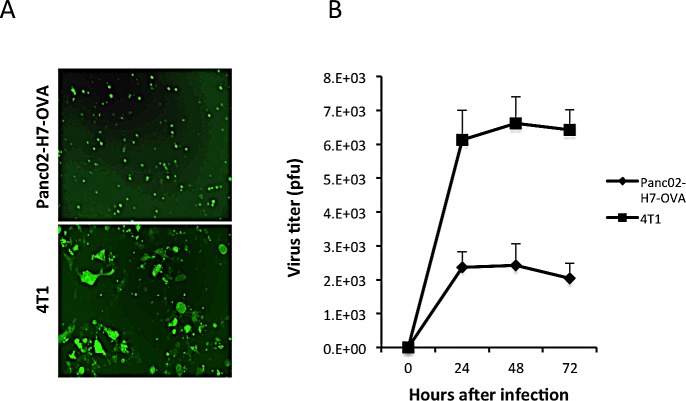
Fig.1. Comparison of permissiveness of Panc02-H7-OVA and 4T1 cells to FusOn-H2.
A. Cells were infected with FusOn-H2 at 5 pfu/cell and micrographs were taken 24 h after infection. Shown is one typical field from each of the cells infected with the virus. Original magnification: 20X. B. Cells were infected with FusOn-H2 at 1 pfu/cell for 1 h. Then cells were harvested at the indicated time and the virus titer was determined by plaque assay of cell lysates on Vero cells.

