
Figure 1. Establishment of a radioresistant oral cancer cell subline and its differential methylation profile.
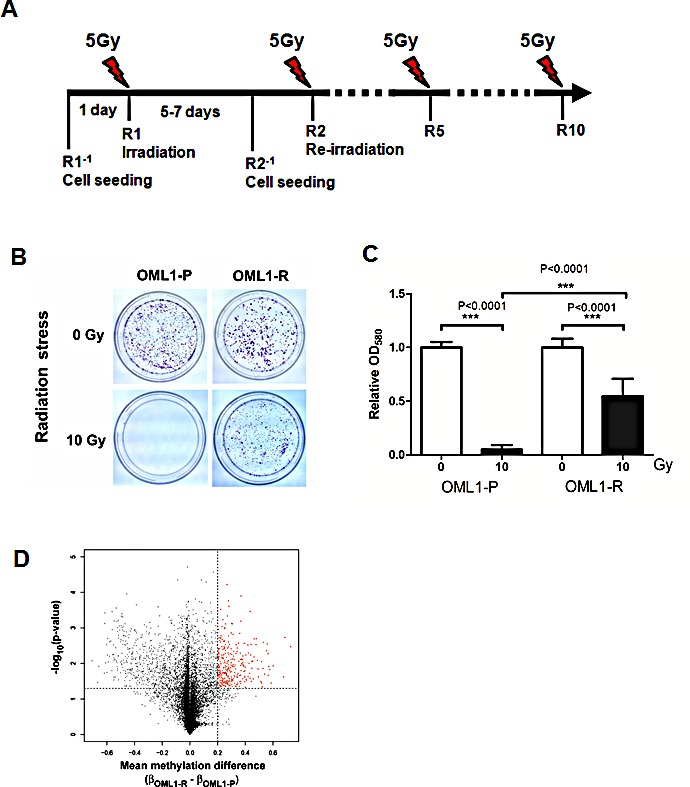
(A) Timeline schema for establishing a radioresistant oral cancer cell subline. One day before irradiation (R1−1, R2−1…etc), cells were seeded onto 10-cm cell culture plates. On the following day (R1, R2…R10), a fraction of 5-Gy irradiation was delivered using a 6-MV linear accelerator. The cells were allowed to recover for 5-7 days before another round of irradiation. This process was repeated for up to 10 fractions (R10) until a total dose of 50 Gy was obtained. The irradiations from R2 to R10 are indicated by dash line. (B) Radiation stress test in parental OML1-P and radioresistant OML1-R cells using a single 10-Gy irradiation. Cells were allowed to recover for several days and then stained with 0.4% crystal violet (C) Quantitative analysis of the radiation stress test described in B. Stained cells were lysed and measured by a spectrophotometer, and the relative number of cells were expressed as OD580. Data are expressed as means ± SD (n=3). (D) Volcano plot showing methylation differences and P values of each probe between OML1-R and their parental OML1-P cells. A total of 24,000 gene loci were compared. Of these, 330 probes (red) demonstrated an increased β value ≥ 0.2 and P <0.05, in OML1-R cells.