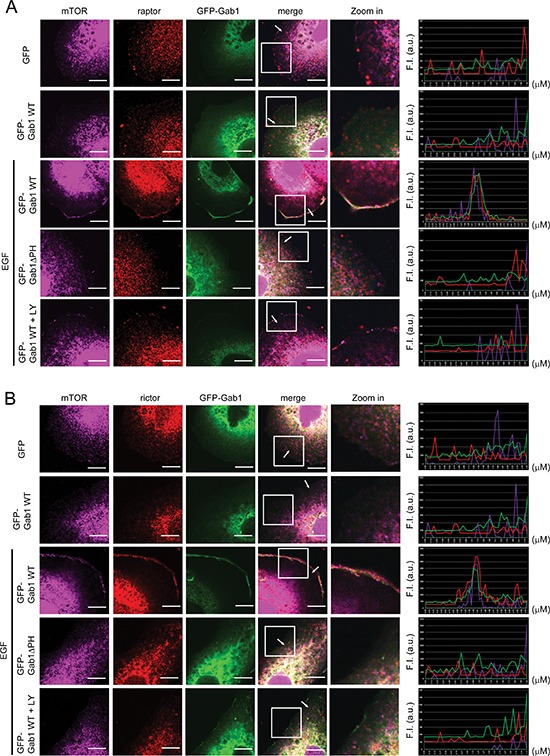
Figure 3. Overexpression of Gab1 promotes plasma membrane of mTORCs after EGF stimulation.

(A) E6 cells transfected with GFP-Gab1wt and GFP-Gab1ΔPH were serum-starved and treated with 100 ng/ml EGF (10 min) and 20 μM LY294002 (60 min). To detect the localization of mTORC1 and Gab1 in E6 cells, immunofluorescence staining was performed. Staining of mTOR (purple), raptor (red), Gab1 (green) and DAPI (blue) are shown. The right panel shows the relative fluorescence intensity (F.I.) at the lines that were scanned by confocal microscopy. a.u., arbitrary unit. (B) The experiments were performed in a manner similar to that described in A. To detect the localization of mTORC2 and Gab1 in E6 cells, immunofluorescence staining was performed. Staining of mTOR (purple), rictor (red), Gab1 (green) and DAPI (blue) are shown. m, mock. LY, LY294002. Scale bar, 10 μm. All experiments, n = 3.
