
Figure 5. Gab1 forms complexes with mTORCs.
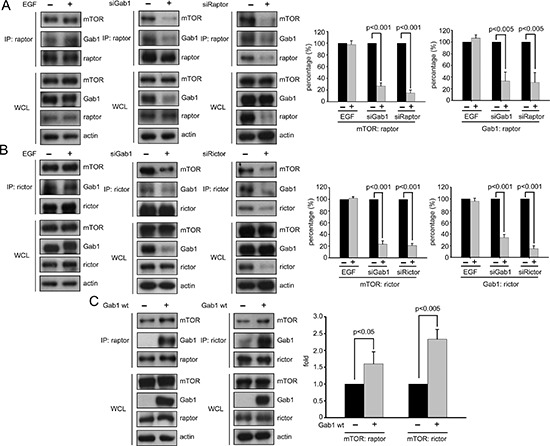
(A) Some T24 cells were serum-starved and then treated with 100 ng/ml EGF for 10 min, and other T24 cells were transfected with Gab1 and raptor siRNA and serum starved. Next, immunoprecipitation of raptor proteins with anti-raptor antibody was performed, and the supernatants from the immunoprecipitations were immunoblotted to detect mTOR, raptor and Gab1. The whole cell lysates (WCLs) were analyzed to detect the same proteins via immunoprecipitation. Quantification of immunoblotting was performed (mean ± SD; p < 0.005). The negative control was shown in Figure S3A. (B) Some T24 cells were serum-starved and then treated with 100 ng/ml EGF for 10 min, and other T24 cells were transfected with Gab1 and rictor siRNA and serum starved. Next, immunoprecipitation of rictor proteins with anti-rictor antibody was performed, and the supernatants from immunoprecipitation were immunoblotted to detect mTOR, rictor and Gab1. WCLs were analyzed to detect the same proteins via immunoprecipitation. Quantification of immunoblotting was performed (mean ± SD; p < 0.001). The negative control was shown in Figure S3B. (C) The E6 cells transfected with Myc-Gab1wt were serum starved, and immunoprecipitation of raptor and rictor proteins with raptor and rictor antibodies was performed. The supernatants from the immunoprecipitation were immunoblotted to detect mTOR, raptor, rictor and Gab1. The WCLs were analyzed to detect the same proteins via immunoprecipitation. The right panel shows quantification of immunoblotting (mean ± SD; p < 0.05). The negative control were shown in Figure S3C and S3D. The All experiments, n = 3.