
Figure 1. GANT61 induces G1 phase arrest and apoptosis in human MMe cells.
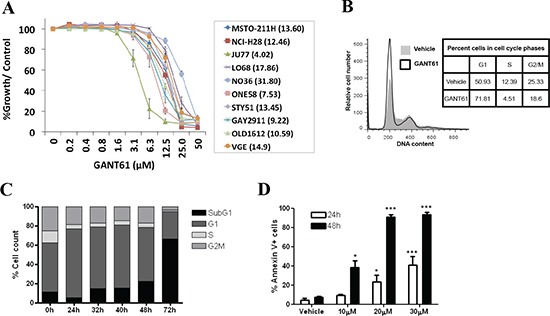
(A) Dose-response cytotoxicity curves for MMe cells treated with GANT61 for 72 h. The dose range tested was 0–50 μM. IC50 values are shown in brackets for each cell line. Values are the mean of independent experiments performed in 6 replicates (mean ± SEM; n = 3). (B) Cell cycle analysis of LO68 cells treated for 24 h with either 20 μM GANT61 (open graph) or vehicle (grey graph). The inset shows the percentage of cells at different phases of the cell cycle (G1, S and G2/M) of GANT61- and vehicle-treated cells. (C) Cell cycle analysis of LO68 cells treated for 0–72 h with 20 μM GANT61. (D) Apoptosis (as assessed by the annexin V/7AAD assay) was quantified in LO68 cells treated with 10, 20 or 30 μM GANT61 or vehicle for 24–48 h. Bar graphs show the quantification of results from independent experiments (mean ± SEM, n = 3). *, p < 0.05 or ***, p < 0.001, compared to vehicle-treated cells.