
Figure 5. Knockdown of GLI1 and GLI2 by siRNA does not increase ROS production in MMe cells.
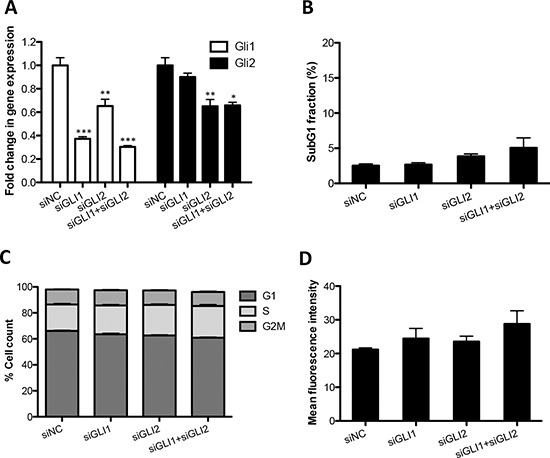
(A) LO68 cells were transfected with negative control (siNC), GLI1 (siGLI1) or GLI2 (siGLI2) siRNA for 96 h, then GLI1 mRNA expression analyzed by qRT-PCR. Values represent the mean ± SEM of three independent experiments each performed in duplicates. *, p < 0.05, **, p < 0.01 or ***, p < 0.001, compared to NC siRNA-transfected cells. (B) Cell death (subG1 fraction) was measured by flow cytometry 96 h after transfection. Data represent the mean ± SEM of three independent experiments. (C) The cell cycle was analyzed by flow cytometry 96 h following transfection. Histogram profiles of flow-cytometric analysis show the cell cycle distribution of the cell population. Data represent the mean ± SEM of three independent experiments. (D) The level of intracellular ROS was monitored using CH2DCFDA and the fluorescence measured by flow cytometry 96 h following transfection. Data represent the mean ± SEM of three independent experiments.