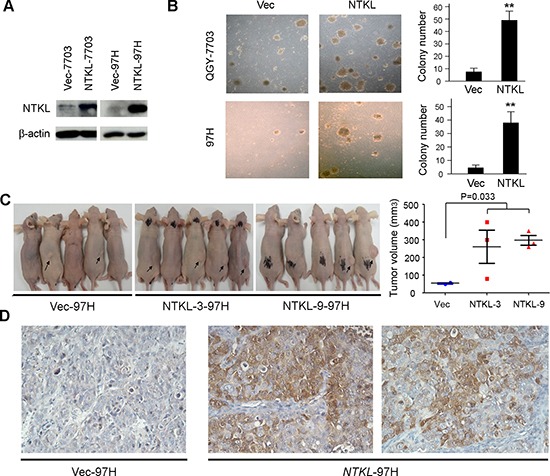
Figure 2. NTKL had strong oncogenic function.

(A) NTKL was stably transfected into HCC cell line QGY-7703 and 97H. Ectopic expression of NTKL was detected by Western blot. (B) Representative images of colony formation in soft agar induced by NTKL-transfected and Vec-transfected cells. The numbers of colonies were calculated and are depicted in the bar chart. The values indicate the mean ± SD of three independent experiments P < 0.001; independent Student's t-test). (C) Control cells and two clones of NTKL overexpressing cells (NTKL-3 and NTKL-9) were subcutaneously injected into nude mice. Representative examples of tumors (indicated by arrows) formed in nude mice injected with the indicated cells. The xenograft tumor volumes were shown in the right panel. (D) IHC staining of NTKL in the xenograft tumors.
