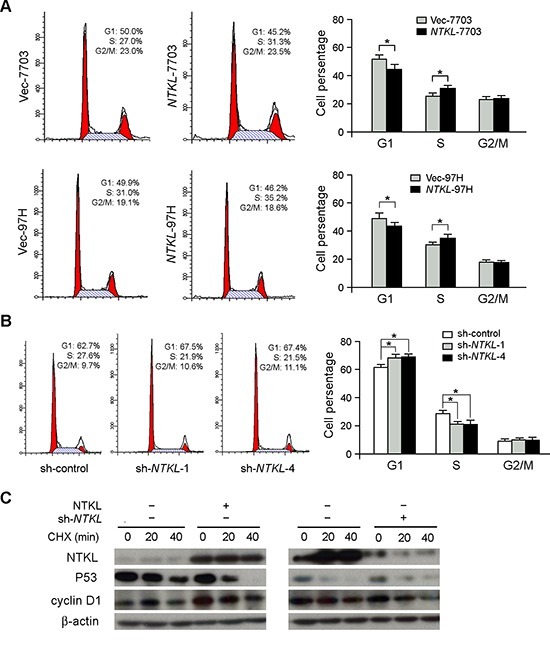
Figure 3. Overexpression of NTKL promoted G1/S transition.

(A) Flow cytometry was used to compare cell cycle distribution between NTKL-transfected and Vec-transfected cells. The percentages of cells at G0/G1, S and G2/M were summarized in bar charts. Data was shown as the mean ±SD of three independent experiments (*, P < 0.05; independent Student's t-test). (B) Depletion of NTKL by RNAi blocked cell cycle at G1 phase. Data were shown as the mean ±SD of three independent experiments (*, P < 0.05; independent Student's t-test). (C) The degradation of P53 and CyclinD1 was regulated by NTKL overexpression and depletion. Cells with NTKL overexpression or depletion were treated with CHX (50ug/mL) for time indicated to inhibit protein synthesis, and the degradation of P53 and CyclinD1 was observed by western blot.
