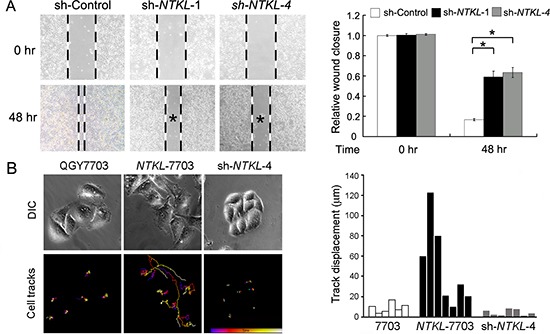
Figure 5. NTKL increased cell motility.

(A) Cell migration ability of sh-Control, sh-NTKL-1 and sh-NTKL-4 cells were detected by wound healing assay. *P < 0.05, independent student's t test. (B) Six to seven cells in one area of QGY-7703, NTKL-7703 and sh-NTKL-4 cells were observed for the migration analysis. Imaris software was applied for locating the center of each nucleus for the drawing of cell track in 300mins. Upper panel showed the cells in each group captured at the start point. Lower panel showed cell track that record the paths cells moved (blue ends, starting points; white ends, ending points). Track displacement of each cell was shown in bar chart.
