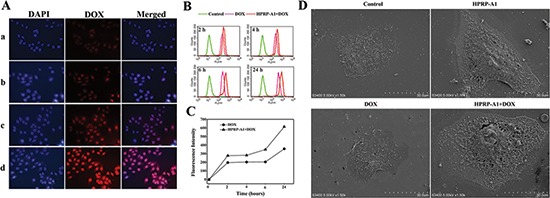
Figure 3. Fluorescence and flow cytometry studies of cellular entry of drugs of HeLa cells treated with DOX alone or DOX and HPRP-A1 combination, and morphological study of HeLa cells treated with different drugs by scanning electron microscopy.

(A) Representative images (400× magnification) of HeLa cells incubated with DOX or DOX+HPRP-A1 at different time intervals: a. DOX (15 μg/ml), 1 h; b. DOX (15 μg/ml) and HPRP-A1 (12 μg/ml), 1 h; c. DOX (15 μg/ml), 3 h; d. DOX (15 μg/ml) and HPRP-A1 (12 μg/ml), 3 h. In panel A, the images from left to right show differential contrast image: cell nuclei stained by DAPI (blue), DOX fluorescence (red), and merged images. (B) Time course of DOX accumulation in HeLa cells exposed to DOX (1.0 μg/ml) or DOX (1.0 μg/ml)+HPRP-A1 (12 μg/ml) for 2, 4, 6 and 24 h, measured using flow cytometry. (C) Quantitative comparison of fluorescence intensity at 2, 4, 6 and 24 h. (D) Scanning electromicroscopic images of HeLa cells treated with HPRP-A1 and/or DOX.
