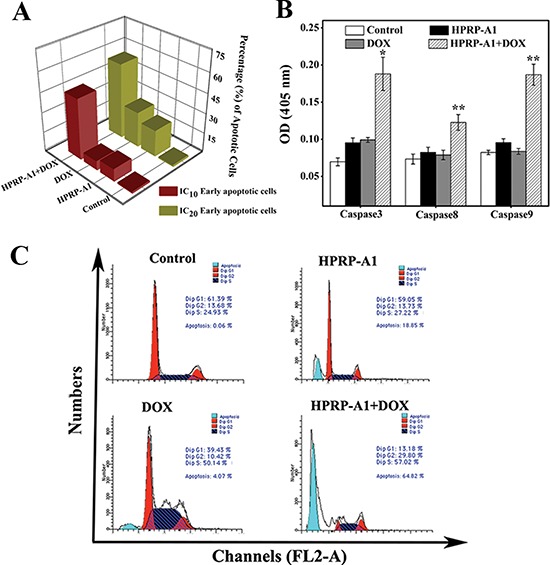
Figure 4. Apoptosis and cell cycle studies of HPRP-A1 and/or DOX in vitro.

(A) Percentage of early apoptotic cells, assessed by flow cytometry. HeLa cells were treated with HPRP-A1 and/or DOX at IC10 and IC20 concentrations (IC10 was 12 and 0.8 μg/ml, and IC20 was 16 and 1.2 μg/ml for HPRP-A1 and DOX, respectively). (B) Caspase-3, -8 and -9 activity. Cells were treated with HPRP-A1 (12 μg/ml) and/or DOX (0.8 μg/ml) for 24 h before measuring caspase activity levels. Data are the mean ± SD of three independent experiments. Statistical analysis compared the HPRP-A1+DOX treatment group with the HPRP-A1 and DOX alone treatment groups (*P < 0.05; **P < 0.01). (C) Cell-cycle phase distribution after treatment with HPRP-A1 (12 μg/ml, IC10) and/or DOX (0.8 μg/ml, IC10) for 24 h, analyzed by flow cytometry. Image shown is representative of three independent experiments.
