(
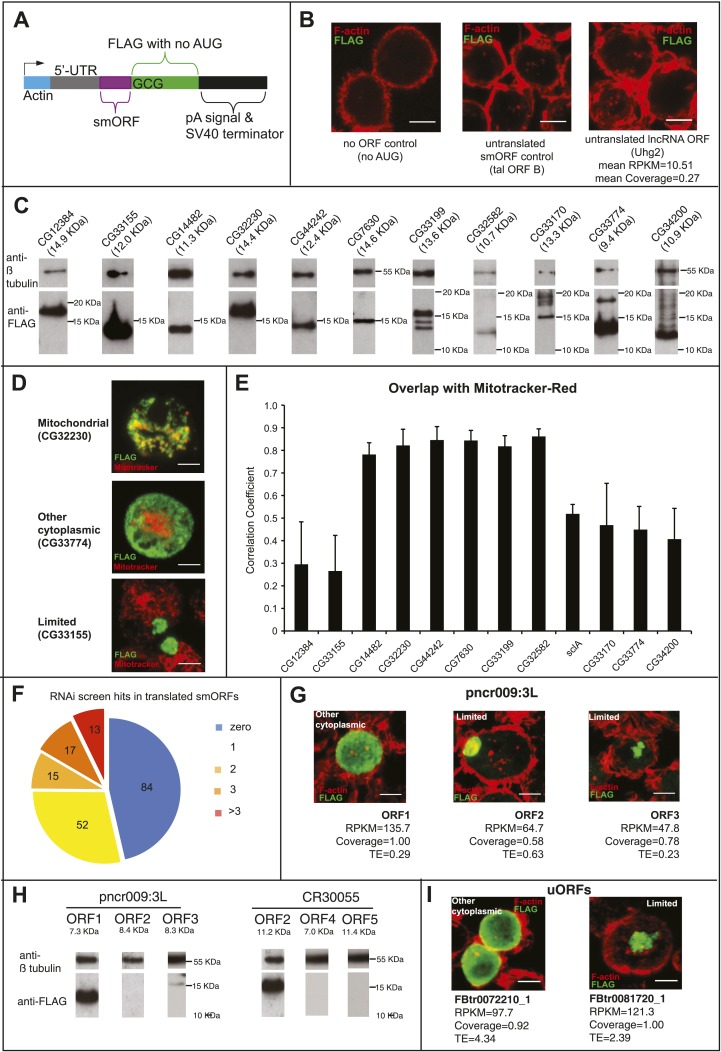
A) Schematic of the transfection construct into which smORF 5′-UTRs and ORFs (no stop codon) were cloned under the Actin promoter, such as to be fused in frame to a C-terminal FLAG tag, with its own AUG start codon mutated to GCG. (
B) Transfection negative controls, plasmid with no ORF (nor AUG), plasmid with the full-length
tal transcript (minus 3′-UTR) with ORF-B tagged with FLAG, which has previously been shown not to be translated (
Galindo et al., 2007), and a plasmid containing a putative smORF that is transcribed but not translated according to our Poly-Ribo-Seq (Uhg2-ORF1). (
C) Immunoblot showing translation of FLAG-tagged smORFs (
Table 3) corresponding to predicted sizes, along with β- tubulin loading control. (
D) Different subcellular localisations of FLAG-tagged smORFs (green) corroborated by double staining with Mitotracker Red (red): “mitochondrial”, “other cytoplasmic” and “limited” (scale bar = 5 μm). (
E) Correlation analysis of colocalisation between FLAG-tagged smORF peptides and Mitotracker Red, error bars represent SD from three experiments. (
F) 50% of S2-cell translated smORFs show function in previous RNAi screens (Flymine). (
G) Translation of FLAG-tagged pncr009:3L (ncRNA) ORFs 1, 2, and 3 in transfection assay with translational metric values shown (FLAG antibody: green, F-actin stained with phalloidin: red, scale bars = 5 μm). (
H) Immunoblot showing detection of FLAG-tagged ORFs from pncr009:3L and CR30055 with predicted sizes (
Table 4), along with β-tubulin loading control. (
I) Translation of FLAG-tagged uORFs FBtr0072210_1 and FBtr0081720_1 in transfection assays with translational metric values shown (FLAG antibody: green, F-actin stained with phalloidin: red, scale bars = 5 μm).


