. 2014 Aug 21;3:e03528. doi: 10.7554/eLife.03528

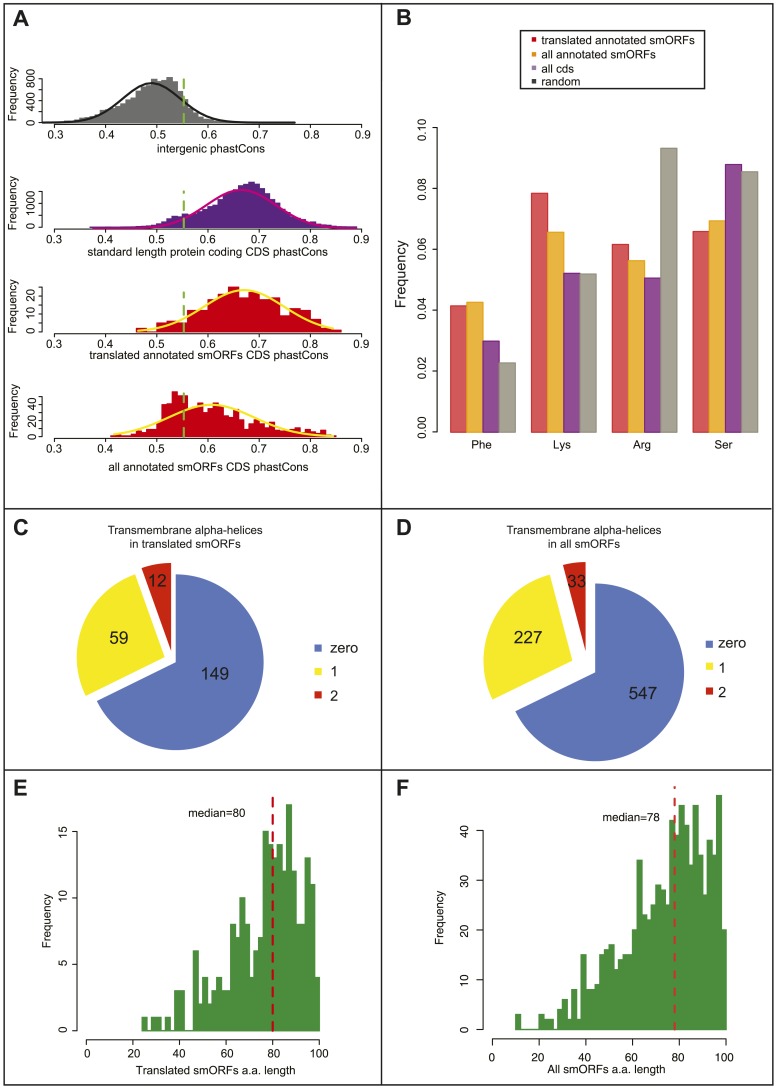
Figure 4. Bioinformatic indicators of smORFs.

(A) Distribution of phastCons scores for intergenic regions, standard length protein-coding CDSs (longer than 100 aa), S2 cell-translated annotated smORFs, and all annotated smORFs, with fitted normal curves. Green dotted lines indicate the 90th percentile of intergenic phastCons scores (0.55). (B) Relative abundance of particular amino acids in proteins (random expected: black, all CDSs: purple, all annotated smORFs: yellow, and translated smORFs: red). (C and D) Proportion of (C) S2-cell translated (32%) and (D) all smORFs (32%) predicted to contain transmembrane α helices (TMHMM). (E and F) Frequency distribution of smORF peptide lengths for (E) translated and (F) all annotated smORFs with medians shown by red dotted line.

DOI: http://dx.doi.org/10.7554/eLife.03528.015

Figure 4.

Figure 4—figure supplement 1. Bioinformatic indicators of smORFs.

Figure 4—figure supplement 1.

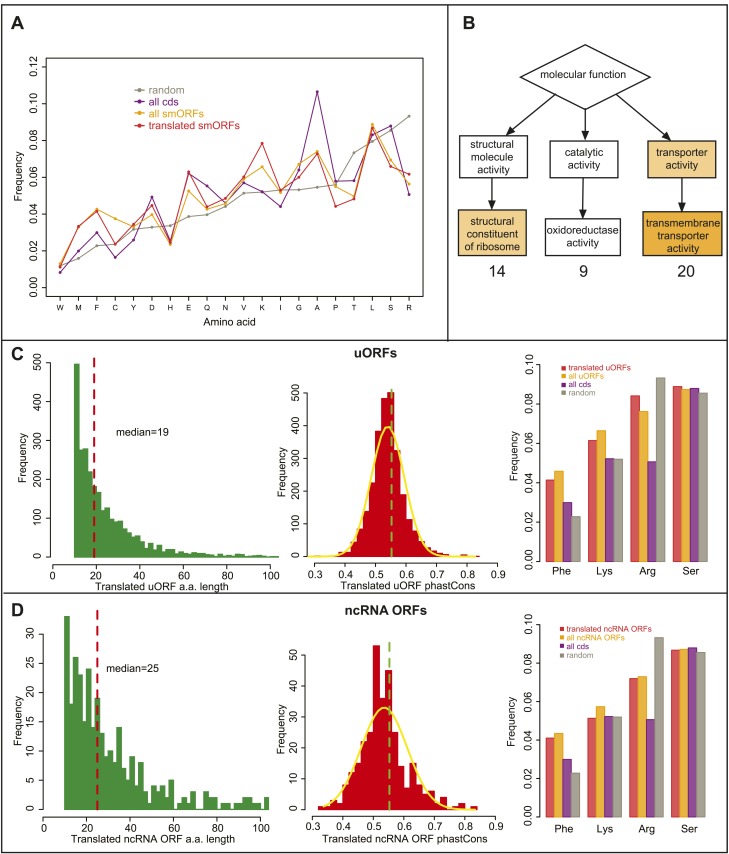
(A) Relative abundance of all amino acids in ORFs, (random: grey, all CDS: purple, all annotated smORFs: yellow, and translated annotated smORFs: red). (B) Enrichment of GO molecular function terms (GOrilla) within translated annotated smORFs in S2 cells when compared to translated standard protein-coding ORFs. Main overrepresented terms are structural consitituents of ribosome (p = 3.28E-4), oxidoreductase activity and transmembrane transporter activity (p = 2.77E-5). (CD) Frequency distribution of peptide lengths, phastCons, and relative abundance of particular amino acids of translated (C) uORFs and (D) ncRNA ORFs. Red dotted lines indicate the median amino acid lengths and green dotted lines indicate the 90th percentile cut-off from phastCons of intergenic regions, 0.55 (Figure 4A).