. 2014 Aug 27;3:e03346. doi: 10.7554/eLife.03346

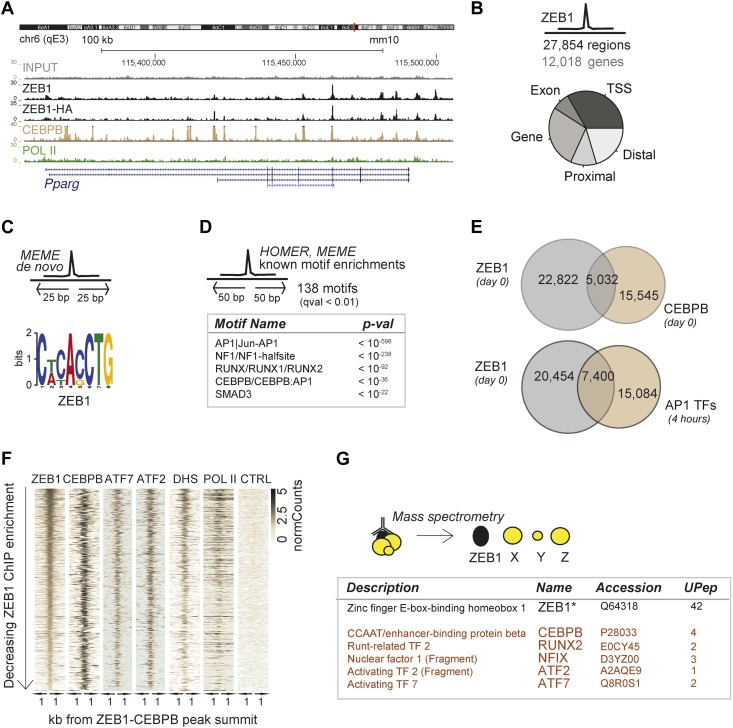
Figure 3. ZEB1 co-binds the genome with established adipogenic regulators such as C/EBPβ.

(A) ZEB1, C/EBPβ, POLII, and Control (CTRL) read density tracks at the Pparg locus. (B) Number of ZEB1-bound regions and of their proximal (≤ 10 kb) genes in 3T3-L1 cells. Distribution of ZEB1 binding with respect to genomic annotation (‘Materials and methods’). (C) De novo motif discovery using MEME and a 50 bp sequence centered on ZEB1 peak summits reveals the canonical ZEB1 motif (p = 10−8, ‘Materials and methods’) (D) Motif enrichment analysis in a 100 bp window around ZEB1 peak summits reveals 138 significantly enriched motifs (complete results in Supplementary file 1E). Highlighted here are motif names of the known early adipogenic regulators C/EBPβ, NFI, and AP1 factors as well as RUNX and SMAD3. (E) Peak overlap between ZEB1 and C/EBPβ (day 0) as well as AP1 factors (day 0, 4 hr) in 3T3-L1 cells. (F) Overview of ZEB1, C/EBPβ, AP1 proteins ATF2 and ATF7, POLII normalized ChIP-seq as well as DNase-seq (DHS) enrichments (‘Materials and methods’) in a 2 kb window around the summits of ZEB1 peaks that overlap C/EBPβ binding. Intervals are sorted based on decreasing ZEB1 enrichment. (G) Summarized results from mass spectrometry experiments of proteins that were identified when pulling down ZEB1 (complete results in Supplementary file 1F [Gubelmann et al., 2014]).

DOI: http://dx.doi.org/10.7554/eLife.03346.009

Figure 3.

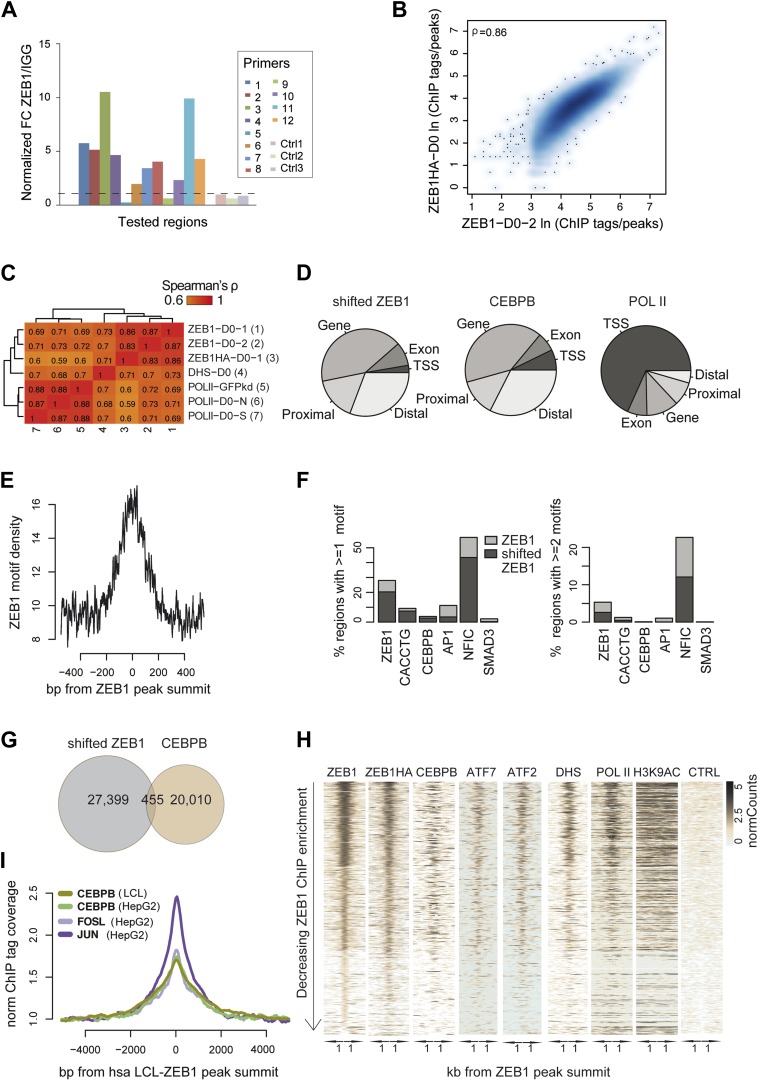
Figure 3—figure supplement 1. ZEB1 co-binds the genome with established adipogenic regulators such as C/EBPβ.

Figure 3—figure supplement 1.

(A) ZEB1 ChIP-qPCR validation of ChIP-seq data at 12 selected ZEB1 target sites and three negative control (CTRL) regions during 3T3-L1 adipogenesis. (B) Scatterplot and Spearman's ρ of ZEB1 ChIP-seq and ZEB1-HA ChIP-seq read counts inside genomic intervals defined by ZEB1 binding in pre-adipocytes. (C) Spearman correlations between read counts for replicate ZEB1 ChIP-seq (including ZEB1-HA) as well as publicly available POLII and DNase-seq data (Siersbæk et al., 2011; Raghav et al., 2012) inside genomic intervals defined by ZEB1 binding in pre-adipocytes. (D) Distribution of randomly shifted ZEB1, C/EBPβ, and POLII peaks with respect to genomic annotation (‘Materials and methods’). (E) ZEB1 motif density at 800 bp centered on ZEB1 peak summits. (F) Fraction of ZEB1 and randomly shifted ZEB1 peaks (to show background values) that contain at least one or two, respectively, ZEB1, CACCTG (E-box), C/EBPβ, AP1, NFIC and SMAD3 motif hits (‘Materials and methods’). (G) Peak overlap between randomly shifted ZEB1 and C/EBPβ bound regions in 3T3-L1 pre-adipocytes. (H) Overview of ZEB1, ZEB1-HA, C/EBPβ, AP1 factors ATF2 and ATF7, POLII and H3K9AC normalized ChIP-seq as well as DNase-seq and control (CTRL) enrichments (‘Materials and methods’) in a 2 kb window around the summits of ZEB1 peaks. Intervals are sorted based on decreasing ZEB1 enrichment. (I) Mean C/EBPβ and AP1 complex proteins JUN and FOSL normalized (to total read number) ChIP-seq enrichments in human HepG2 and lymphoblastoid cell lines (LCLs) in a 8 kb window around the summits of ZEB1 peaks detected in LCLs.
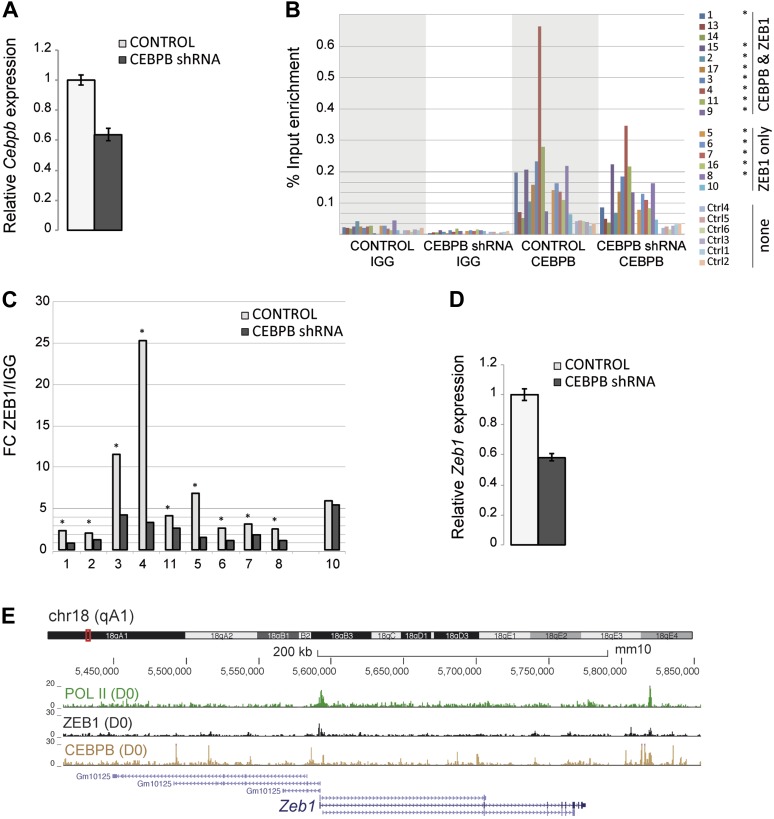
Figure 3—figure supplement 2. ZEB1 binding and expression is affected by C/EBPβ KD.

Figure 3—figure supplement 2.

(A) C/EBPβ expression (mRNA level) in stable C/EBPβ KD and control 3T3-L1 pre-adipocytes as measured by qPCR. (B) C/EBPβ ChIP-qPCR at 10 C/EBPβ-ZEB1, 6 ZEB1-only and six negative control regions according to our ZEB1 D0 ChIP-seq data and publicly available C/EBPβ ChIP-seq data (Siersbæk et al., 2011). 5 out of 6 ZEB1-only regions also show C/EBPβ ChIP enrichment. *C/EBPβ-enriched regions (C) ZEB1 ChIP-qPCR at 9 C/EBPβ-ZEB1 regions as well as one ZEB1-only region (10) in C/EBPβ KD and control 3T3-L1 cells. * regions showing changes in ZEB1 enrichment after C/EBPβ KD (D) Zeb1 expression (mRNA level) in stable C/EBPβ KD and control 3T3-L1 cells as measured by qPCR. (E) POLII, ZEB1, and C/EBPβ read density tracks at the Zeb1 locus in 3T3-L1 pre-adipocytes.