. 2014 Aug 27;3:e03346. doi: 10.7554/eLife.03346

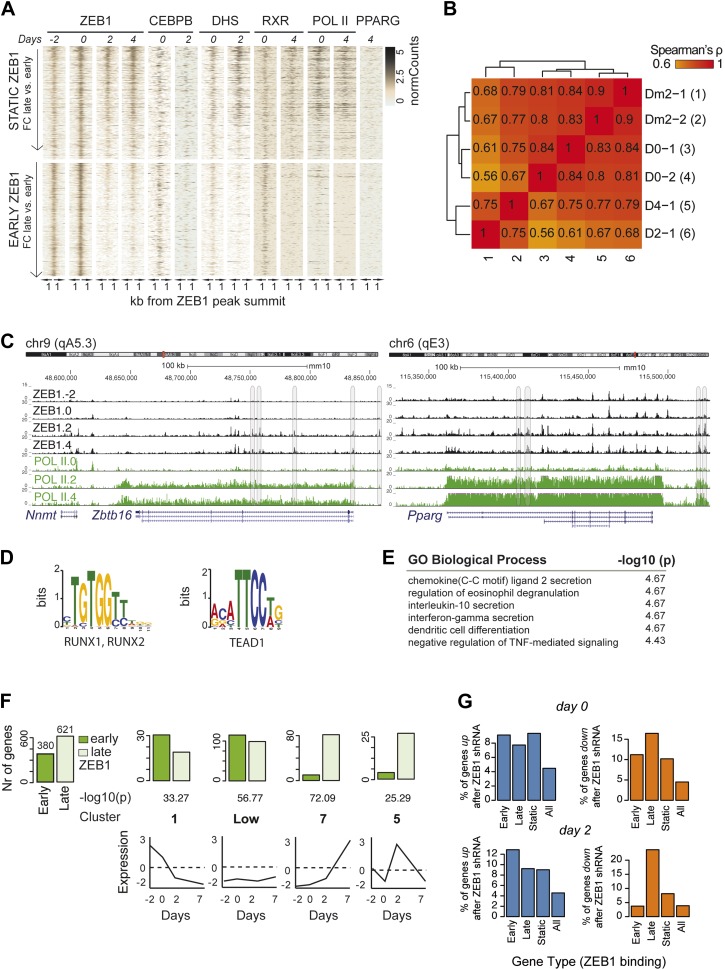
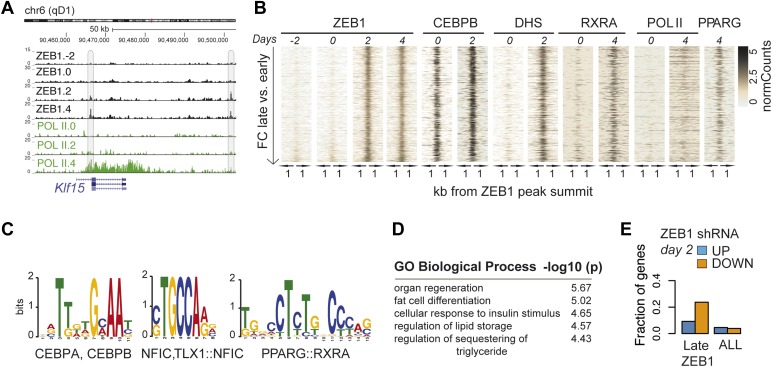
Figure 4. ZEB1 binding increases at adipogenic genes during 3T3-L1 differentiation.

(A) ZEB1 and POLII read density tracks at the Klf15 locus during 3T3-L1 differentiation (days −2, 0, 2, and 4). Late-only bound regions are highlighted. (B) ZEB1, C/EBPβ, RXRα, PPARγ, POLII normalized ChIP (‘Materials and methods’) as well as DHS enrichments in a 2 kb window around the summits of late-only (days 2 and 4 but not days −2 and 0; padj ≤ 0.1, FC ≥ 2) ZEB1-bound regions during 3T3-L1 differentiation. (C) Differential motif discovery using MEME and a 50 bp sequence centered on summits of late-only vs. static ZEB1 peaks reveals adipogenic motifs: C/EBPα|C/EBPβ, NFIC and PPARG::RXR (p < 10−3, ‘Materials and methods’). (D) GREAT-based (McLean et al., 2010) Gene Ontology enrichment analysis of genes associated with late-only vs. static ZEB1 binding reveals terms associated with fat cell differentiation and function (complete results in Supplementary file 1G [Gubelmann et al., 2014]). (E) Fraction of genes associated with late-only ZEB1 binding and fraction of all genes significantly up (blue) and down (orange)-regulated after ZEB1 KD as measured at differentiation day 2 (complete results in Figure 4—figure supplement 1G).

DOI: http://dx.doi.org/10.7554/eLife.03346.012

Figure 4.

Figure 4—figure supplement 1. ZEB1 binding increases at adipogenic genes during differentiation.

Figure 4—figure supplement 1.

(A) Overview of ZEB1, C/EBPβ, RXRα, PPARγ, POLII normalized ChIP-seq as well as DNase-seq enrichments (‘Materials and methods’) in a 2 kb window around the summits of static (padj ≥ 0.1 or FC < 2) and early-only (days-2 and 0 but not days 2 and 4; padj ≤ 0.1, FC ≥ 2) ZEB1-bound regions during 3T3-L1 differentiation. (B) Spearman correlations between read counts for ZEB1 ChIP-seq data at distinct adipogenic time points (days −2, 0, 2, and 4) inside genomic intervals defined by ZEB1 binding at any of these time points. (C) ZEB1 and POLII read density tracks at the Zbtb16 and Pparg loci during 3T3-L1 differentiation (days-2, 0, 2, and 4). Summarized genome-wide results are included in Supplementary file 1G. (D) Differential motif discovery using MEME and a 50 bp sequence centered on summits of early-only vs static ZEB1 peaks reveals non-adipogenic motifs: RUNX1/2 and TEAD1 (p < 10−5, ‘Materials and methods’). (E) GREAT-based (McLean et al., 2010) Gene Ontology enrichment analysis of genes associated with early-only vs static ZEB1 binding reveals terms associated with chemokine secretion and non-adipogenic functions. Full results are displayed in Supplementary file 1G. (F) Number of significantly up- or down-regulated genes associated (≤10 kb) with at least one early-only or late-only ZEB1 bound region, respectively, belonging to previously defined expression clusters (1/Low/7/5) (Mikkelsen et al., 2010). The typical expression pattern of genes in each cluster is sketched. Clusters are sorted by increasing enrichment of late-only ZEB1-bound genes and corresponding p-values (chi-square test) are listed. Only clusters showing a highly significant p-value (p < 10−10) are shown. (G) Fraction of genes associated with early-only, late-only, and static ZEB1 binding as well as the fraction of all genes significantly up (blue) and down (orange)-regulated after ZEB1 KD as measured at differentiation days 0 and 2.