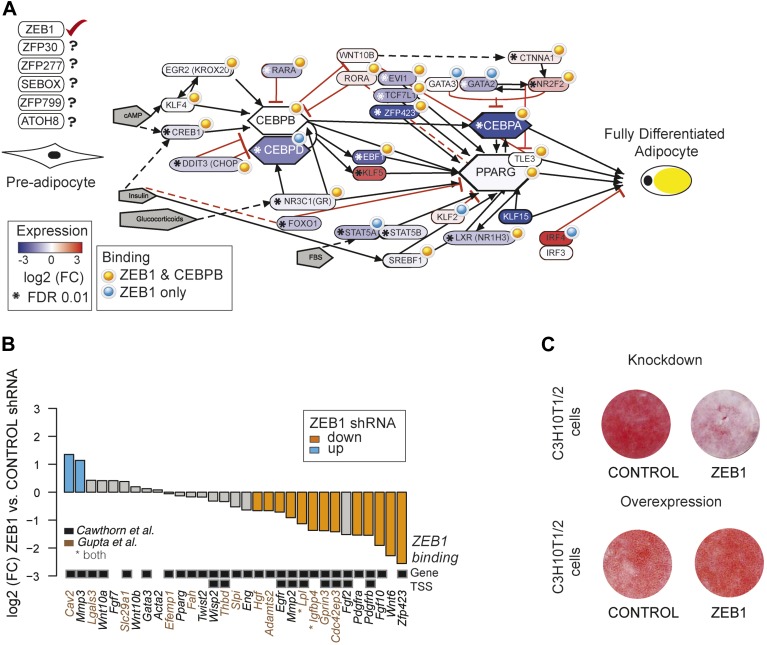
Figure 5. ZEB1: a central component of the adipogenic regulatory network.
(A) Effect of ZEB1 knockdown on the adipogenic gene regulatory network. The network was assembled on the ‘Adipogenesis’ Pathway scaffold in WikiPathways as well as reviews and most recent publications of novel adipogenic regulators (Rosen and MacDougald, 2006; Kelder et al., 2012; Siersbæk et al., 2012). ZEB1 and C/EBPβ-bound regions that are proximal (within 500 bp) to TSSs or genes in pre-adipocytes are highlighted. *Significant (padj ≤ 0.01) expression changes after ZEB1 KD at day 0 of 3T3-L1 differentiation. Other candidate adipogenic regulators identified by our high throughput screen are listed. (B) Expression changes of adipogenic commitment genes after ZEB1 KD in 3T3-L1 pre-adipocytes as measured by RNA-seq. Displayed genes are either part of the pre-adipocyte expression signature derived by Gupta et al. (2010) or of the list of pre-adipocyte commitment factors compiled by Cawthorn et al. (2012). Lpl and Igfbp4 occur in both lists. Significant differences in expression (padj ≤ 0.01) are marked in orange (FC ≤ 0.67) and blue (FC ≥ 1.5). Black-grey squares depict ZEB1 binding to TSSs or gene bodies. (C) Effect of ZEB1 knockdown and overexpression on C3H10T1/2 adipogenesis as assessed by Oil Red O staining at day 7 and day 8, respectively after induction.


