
Figure 2. Mutation enriched loci (MELs) identified by focussed deaminase-induced mutation.
(A) Radial histograms depict the density (Z-score) of pooled mutations for each dataset in 2 kb overlapping genomic segments along each chromosome. The CAN1 locus is highlighted in red. The peak highlighted in cyan is further enlarged in panels (B), (C) and (D). (B) Mutation densities along ChrII in AID* (red), sA3G* (black) and EMS (blue) treated genomes, expressed as the Z-score of mutation density per dataset (y-axis) along chromosome II (x-axis; 200 bp bin size). The region shadowed in cyan is magnified in (C). (C) Regions of high mutation density identify narrow mutation enriched regions (MELs), shown as green boxes for AID* and purple boxes for sA3G* in the bottom panel. Horizontal lines represent a single genome with each non-clonal mutation at C or G indicated by a dot (black or red respectively). Regions in Chr II and Chr X containing mutation enriched loci shown at the same scale, with the genomic coordinates indicated. (D) Mutations in the pronounced MEL on ChrII (highlighted cyan in panels (A), (B) and (C) shown in green for AID* and purple for sA3G*. Coordinates are indicated. (E) Overlap of detected MELs in AID*, sA3G* and EMS datasets. (F) Distribution of MELs width with the median indicated for AID* and sA3G* mutated genomes. (G) Fraction of the total deaminase mutations in MELs (black boxes) relative to genomic coverage of MELs. (H) Distribution of distances between AID and A3G mutable motifs within MELs vs genome wide mutable motif distances.

Figure 2—figure supplement 1. Overlap between Haploid and Diploid MELs.
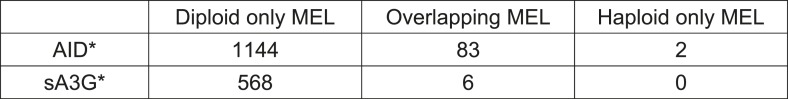
Figure 2—figure supplement 2. Strand bias in deaminase induced mutations calculated as fraction of mutations at C (+strand) or G (- strand) within each MEL.
