. 2014 Sep 19;3:e03553. doi: 10.7554/eLife.03553

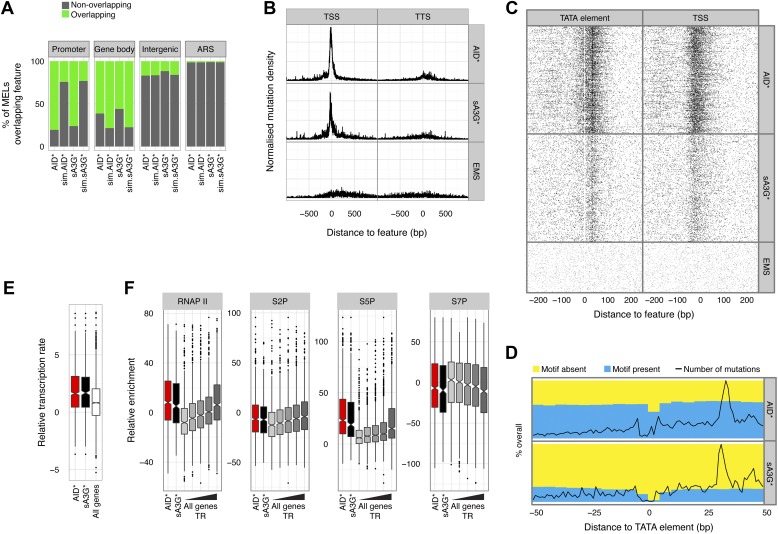
Figure 3. Deaminase mutation footprints are focussed to the pre-initiation complex region of active promoters.

(A) Proportion of promoters, gene bodies, intergenic regions and replication origins (ARS) harbouring a MEL (green) or not (grey) for AID* and sA3G* datasets vs the expected distribution (sim.AID*sA3G*) determined by Monte Carlo simulation of equivalent sized fragments for each MEL dataset distributed randomly across the genome. (B) Density of mutations in relation to their distance to the nearest transcription start site (TSS) of mRNA (RNAP II) transcripts compared to the density relative to transcription termination sites (TTS). Data includes all mutations in addition to MELs. (C) Deaminase mutations relative to the TATA or TATA-like element for each RNAP II promoters (Rhee and Pugh, 2012) compared to the mutation distance distribution aligned to the transcription start site (TSS). (D) Proportion of AID* or sA3G* mutable motifs within RNAP II promoter regions, centred on the TATA-elements (Rhee and Pugh, 2012). Total number of mutations for each dataset is shown at each position (black line). (E) Relative transcription rates (see methods) at RNAP II promoters targeted by MELs compared to relative transcription rates for all RNAP II genes in gal induced conditions (García-Martínez et al., 2004). (F) Relative enrichment of RNAP II and RNAP II CTD phosphorylation (S2P, S5P and S7P) in promoters containing AID* (red) and sA3G* (black) MELs and all RNAP II promoters (grey) ranked according to transcriptional activity (García-Martínez et al., 2004).

DOI: http://dx.doi.org/10.7554/eLife.03553.008

Figure 3.

Figure 3—figure supplement 1. Paucity of deaminase mutations at replication origins is not a consequence of absence of mutable motifs.

Figure 3—figure supplement 1.

Proportion of AID* or sA3G* mutable motifs around replication origins (ARS), depicted as in Figure 3D. Total number of mutations for each dataset is shown for at position (black line, scale as in Figure 3D).
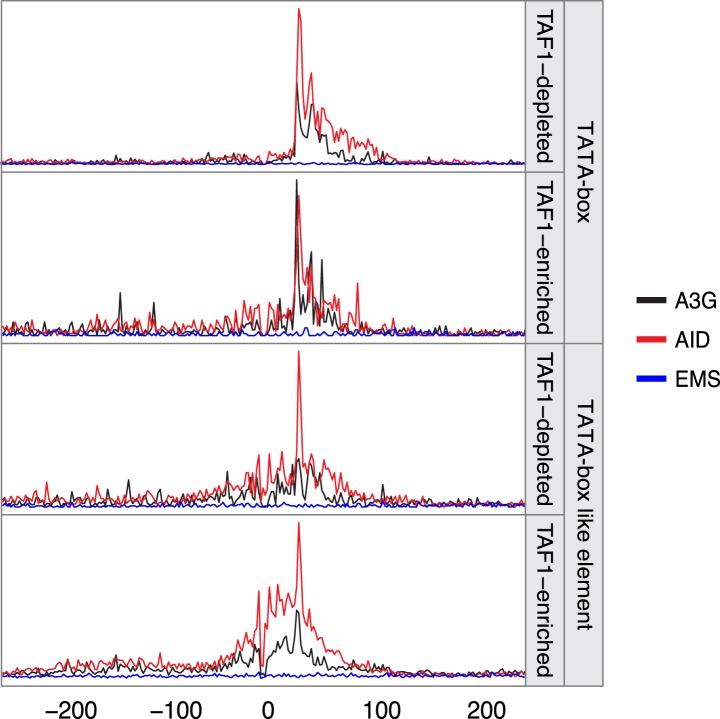
Figure 3—figure supplement 2. Density of mutations in relation to their distance to the nearest TATA box or TATA-like element.

Figure 3—figure supplement 2.

Mutations are grouped according to the TAF1 enrichment status (data from Rhee and Pugh, 2012) with the line colour depicting the mutator (AID*, red; sA3G*, black; EMS, blue). Data includes all mutations in addition to MELs.
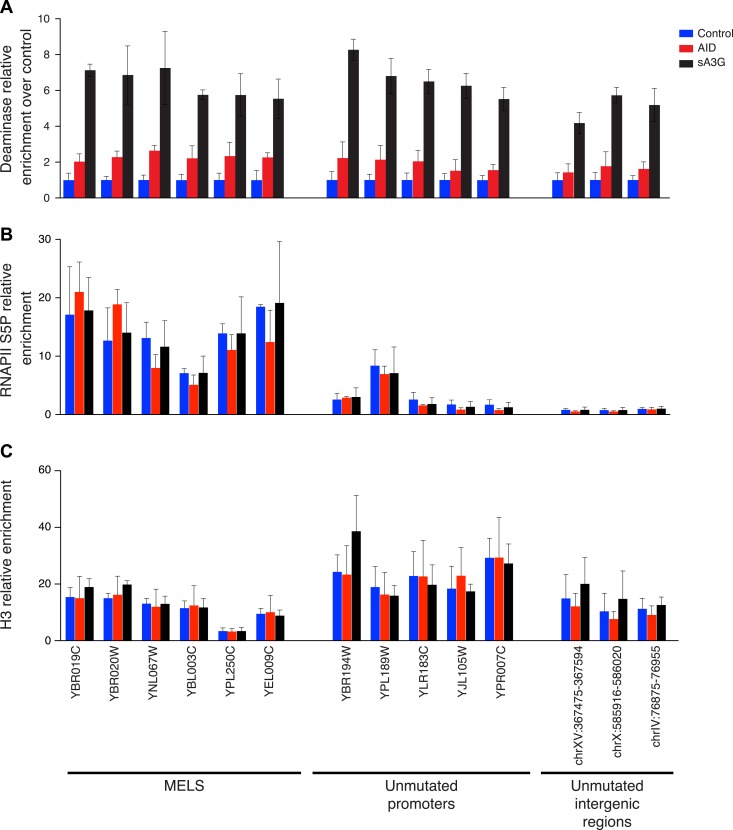
Figure 3—figure supplement 3. Distribution of the deaminases on chromatin is unrelated to mutation preferences.

Figure 3—figure supplement 3.

Enrichment of (A) deaminase, (B) serine 5 phosphorylated RNAPII and (C) Histone H3 at MEL promoters, unmutated promoters and intergenic regions. Enrichment is shown relative to input chromatin (B and C) or further normalised to control cell lines (A). Data from 2–3 independent experiments.
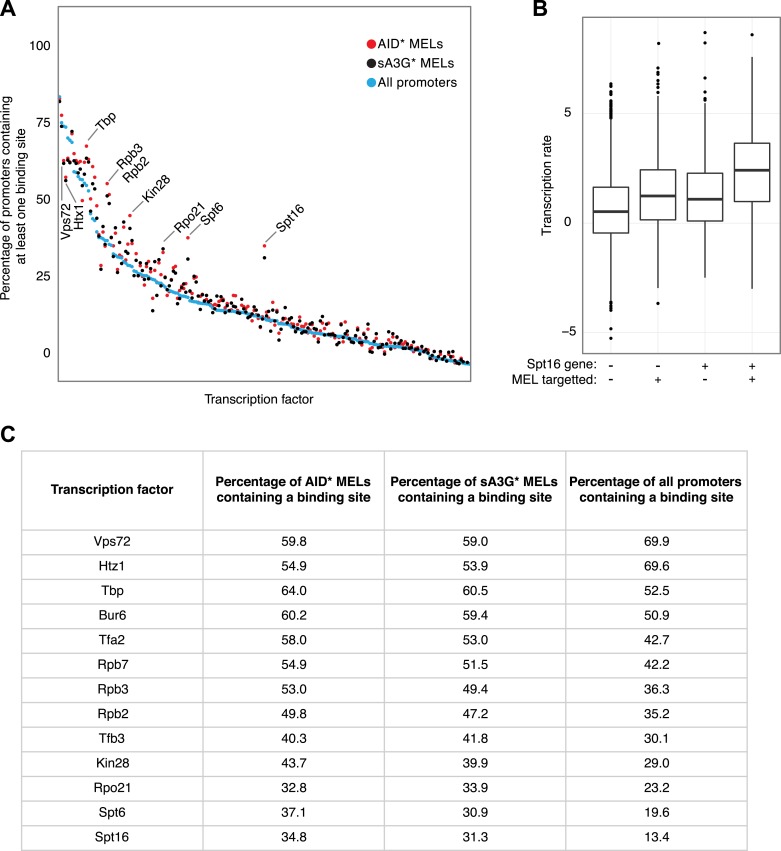
Figure 3—figure supplement 4. Transcription factor binding sites compared to MEL preferences.

Figure 3—figure supplement 4.

(A) Frequency of each yeast transcription factor at individual promoters as described in (Venters et al., 2011) (blue dots) compared with the frequency that the transcription factor appears in the promoter of genes containing AID* (red dots) and sA3G* (black dots) MELs. Factors are ordered according to number of binding sites in all promoters. Basal transcription factors are the most commonly associated with deaminase targeted promoters (labelled). (B) Transcription rates of genes grouped according to Spt16 promoter occupancy and presence of MELs. (C) List of transcription factors found to vary in occupancy at MEL targeted promoters vs their overall frequency at all yeast promoters (Venters dataset). Transcription factors showing ±10% variation which are present in at least 25% of MELs are listed.