. 2014 Sep 19;3:e03553. doi: 10.7554/eLife.03553

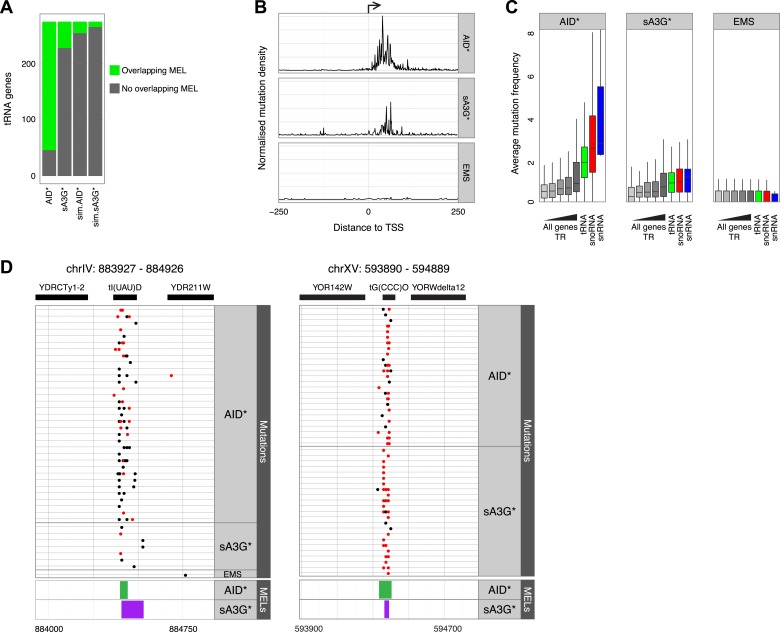
Figure 4. AID* and sA3G* target both RNAP II and RNAP III promoters.

(A) Number of tRNA genes harbouring (green) an AID* or sA3G* MEL compared with expected number from Monte Carlo simulations. (B) Density of mutations in relation to the transcription start site (TSS) of tRNA genes. Mutations within the 500 base pair interval centred at the TSS are included. (C) Mutation frequency in promoters of mRNA genes (within a window 500 bp upstream and 50 bp downstream of the TSS) compared to the frequency of mutations in the promoters of tRNA (550 bp window centred on the middle of the tRNA gene), snoRNAs and snRNA genes (550 bp window as for mRNA genes). mRNA genes are binned according to transcription rate as in Figure 3. Both RNAP II and III driven snoRNAs are included. (D) Example of MELs in ChrIV and ChrXV corresponding to tRNA tI(UAU)D and tG(CCC)O, depicted as in Figure 3.

DOI: http://dx.doi.org/10.7554/eLife.03553.013

Figure 4.

Figure 4—figure supplement 1. Median number of mutable motifs in promoter regions.

Figure 4—figure supplement 1.

Figure 4—figure supplement 2. Mutationally enriched loci are not a consequence of increased density of mutable motifs.

Figure 4—figure supplement 2.

The number of deaminase motifs for each MEL vs the number of mutations within each MEL for AID* and sA3G* datasets.
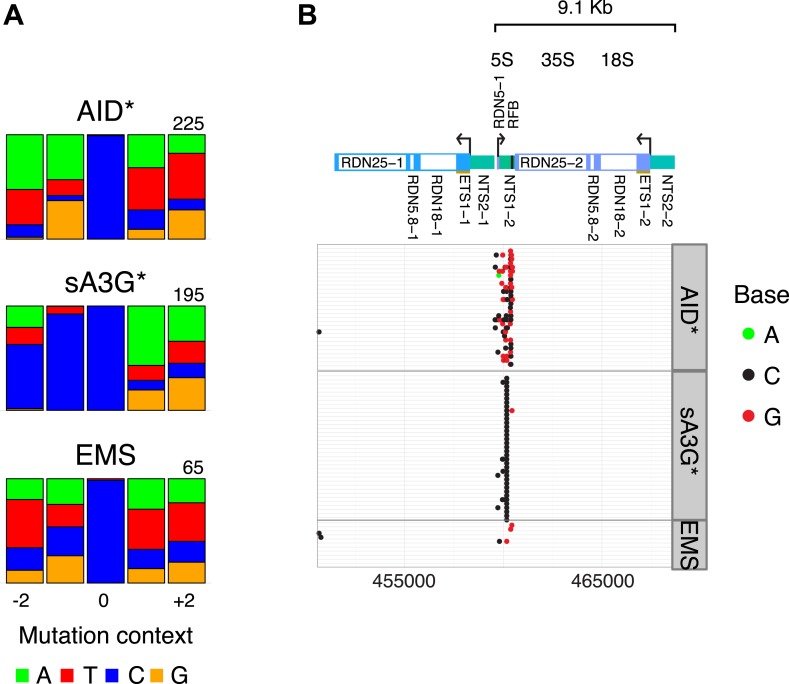
Figure 4—figure supplement 3. Mutations in the rDNA locus are restricted to the replication fork block (RFB) site.

Figure 4—figure supplement 3.

(A) Sequence context of low allelic frequency mutations detected in the rDNA locus, as depicted in Figure 1C. (B) Schematic of the rDNA repeat region. Panels show mutations detected in yeast transformants at the rDNA locus. Each line represents one clone with dots representing mutations (mutation at C, black; at G, red; at A, green). Clones with no detected mutations are not depicted.
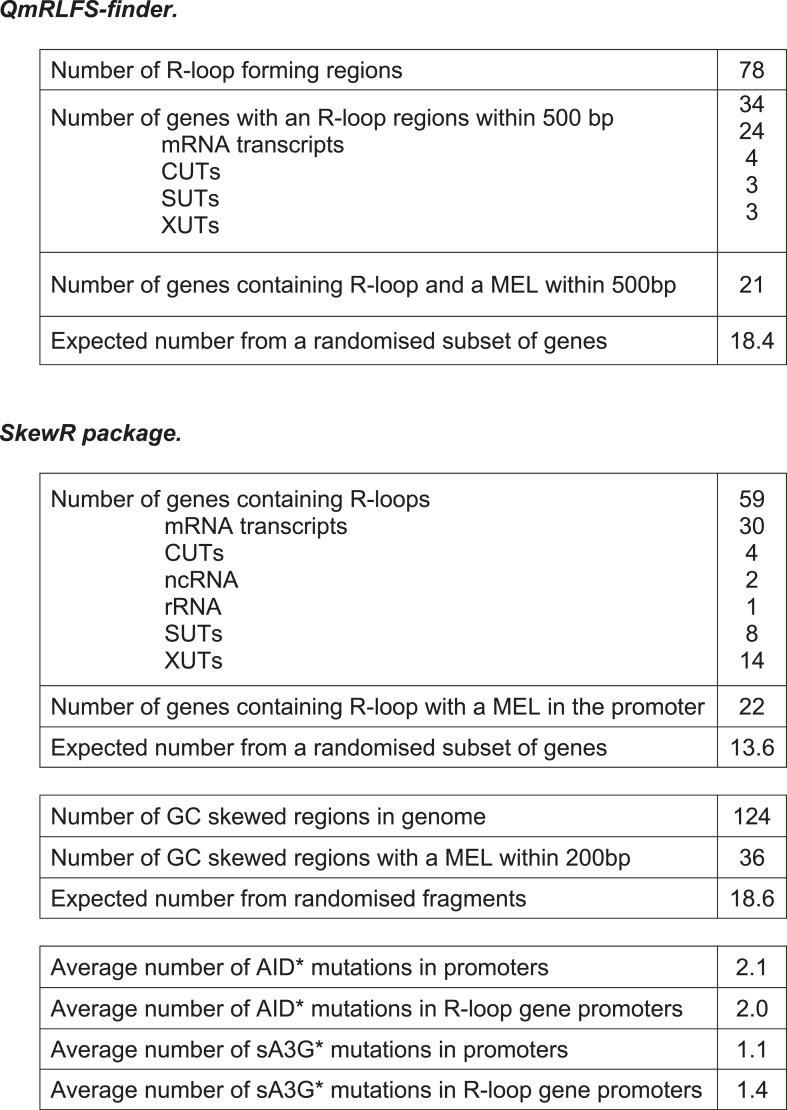
Figure 4—figure supplement 4. Deaminase induced mutation distribution in relation to R-loop forming potential.

Figure 4—figure supplement 4.

Tables showing the correlation between R-loops formation predicted by the QmRLFS-finder (Wongsurawat et al., 2012) or SkewR package (Ginno et al., 2012) and the presence of MELs.