. 2014 Sep 19;3:e03553. doi: 10.7554/eLife.03553

Figure 5. RNA binding by human AID and APOBEC3G.

(A) Left panel shows the in vitro transcribed pre-tI(UAU)D tRNA used for affinity purification. Right panel shows immunoblots for transiently overexpressed AID/APOBEC3G proteins following RNA-immunoprecipitation with pre-tRNA. (B) Affinity purification with tl(UAU)D probe, total yeast tRNA, homopolymeric single stranded (polyU) and double stranded (polyA:U) RNA. Left panel shows input proteins, right panel shows immunoblots for transiently overexpressed AID/APOBEC3 proteins following RNA-immunoprecipitation. Results representative of at least 3 independent experiments. (C) Deaminase induced mutations in the promoter region of the YBR194W locus. Top panels: accumulated mutations in the AID*, sA3G* and EMS whole genome datasets. Bottom panels: mutations detected in Sanger sequenced yeast clones unmodified or harbouring a chimeric YBR194W-snR6 locus. Each line represents one clone with dots representing mutations (at C, black; at G, red). Clones with no mutations are indicated.

DOI: http://dx.doi.org/10.7554/eLife.03553.018

Figure 5.

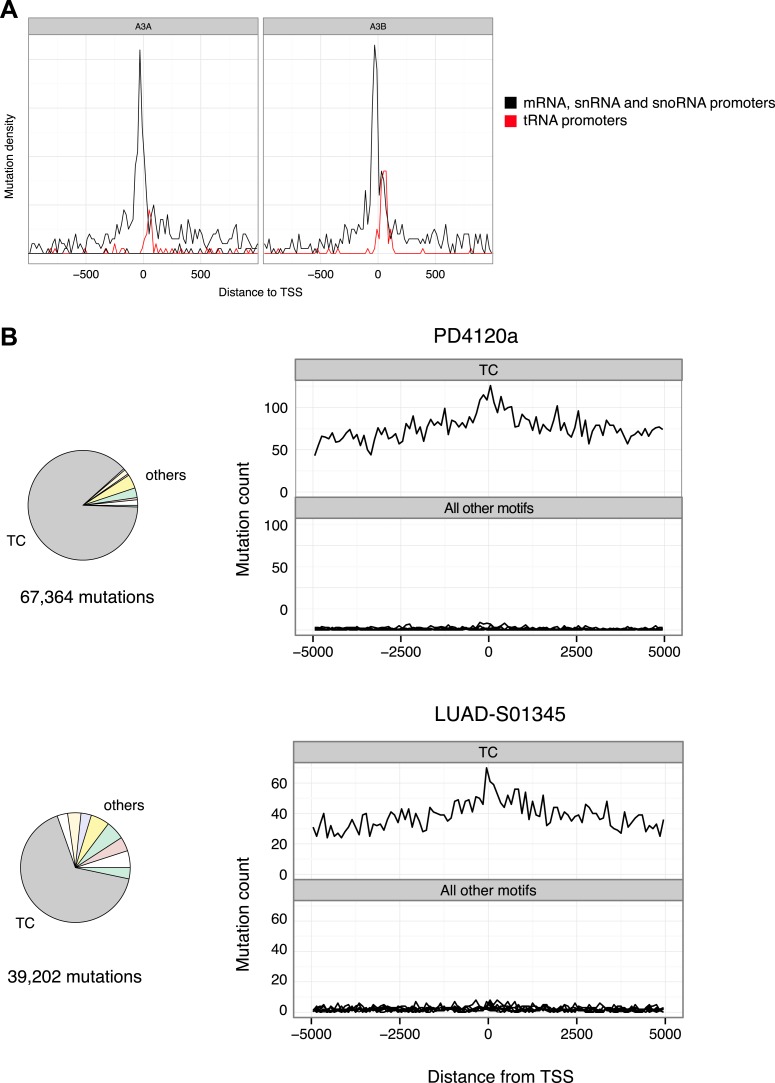
Figure 5—figure supplement 1. Promoter mutations are driven by APOBEC3A and 3B and are a feature of cancer genomes enriched for TC mutations.

Figure 5—figure supplement 1.

(A) Mutation density relative to the TSS for APOBEC3A and APOBEC3B induced mutations from ungΔ haploid cells (data from Taylor et al., 2013). The density at tRNA promoters is shown separately in red. (B) Mutations in breast cancer genome PD4120a and lung adenocarcenoma LUAD-S01345. Pie charts show the contribution of mutations at TC over mutations at the remaining dinucleotides and histograms show mutation density relative to all human TSS (Ensemble annotation).
Figure 5—figure supplement 2. Functional comparison of the YBR194W locus in modified yeast clones.

Figure 5—figure supplement 2.

(A) Immunoprecipitation of chromatin associated RNAP II or (B) Histone H3 from unmodified or YBR194W-snR6 chimeric yeast. Black bars show enrichment relative to input in the unmodified strain with the modified strain in red. An unrelated locus, YJL105W is shown as control. Data from three independent experiments. (C) mRNA levels of YBR194W shown relative to ACF1. Levels at the TAF10 gene are shown as a control. Data from three independent experiments.