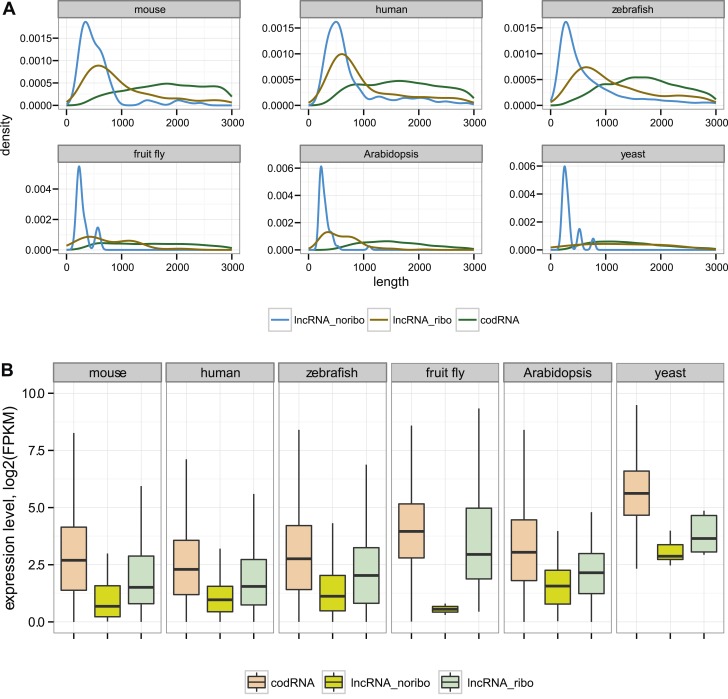
Figure 1. General characteristics of codRNA and lncRNA transcripts.
(A) Density plots of transcript length. (B) Box-plots of transcript expression level in log2(FPKM) units. lncRNA_ribo: lncRNAs associated with ribosomes; lncRNA_noribo: lncRNAs for which association with ribosomes was not detected. codRNA: coding transcripts encoding experimentally validated proteins except for zebrafish in which all transcripts annotated as coding were considered. The area within the box-plot comprises 50% of the data and the line represents the median value. In all studied species, codRNAs were expressed at higher levels than lncRNAs (Wilcoxon test, p < 10−5), and lncRNA_ribo at higher levels than lncRNA_noribo (Wilcoxon test, p < 0.005).

