. 2014 Sep 16;3:e03523. doi: 10.7554/eLife.03523

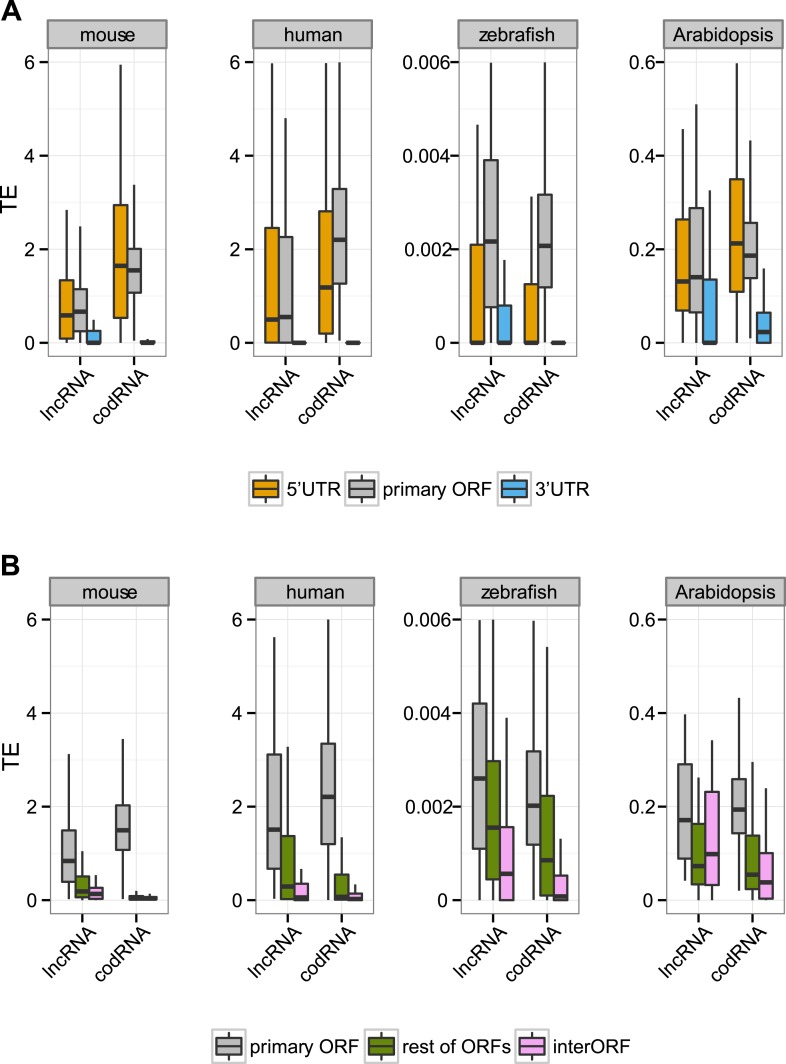
Figure 5. Ribosome association in different transcript regions.

(A) Density plot of the relative length of the primary ORF in lncRNA_ribo and codRNA with respect to transcript length. For comparison data for the longest ORF in lncRNA_noribo is also shown (except for fruit fly due to insufficient data). (B) Box-plots of TE distribution in primary ORF, 5′UTR, and 3′UTR regions. The area within the box-plot comprises 50% of the data, and the line represents the median value. The analysis considered all transcripts with 5′UTR and 3′UTR longer than 30 nucleotides and >0.2 FPKM in all three regions. The number of transcripts was 1956 codRNA and 159 lncRNA_ribo in mouse, 3558 codRNA and 139 lncRNA_ribo in human, 5216 codRNA and 252 lncRNA_ribo in zebrafish, and 2019 codRNA and 33 lncRNA_ribo in Arabidopsis. (C) Box-plots of TE distribution in primary ORFs, rest of ORFs with ribosome profiling reads and non-ORF regions (interORF). The analysis considered all transcripts with at least two ORFs and more than 30 nucleotides interORF. The number of transcripts was 3264 codRNA and 204 lncRNA_ribo in mouse, 3104 codRNA and 168 lncRNA_ribo in human, 1646 codRNA and 212 lncRNA_ribo in zebrafish, and 1098 codRNA and 25 lncRNA_ribo in Arabidopsis. Fruit fly and yeast were not included in the last two analyses due to insufficient data (<8 lncRNA_ribo meeting the conditions).

DOI: http://dx.doi.org/10.7554/eLife.03523.011

Figure 5.

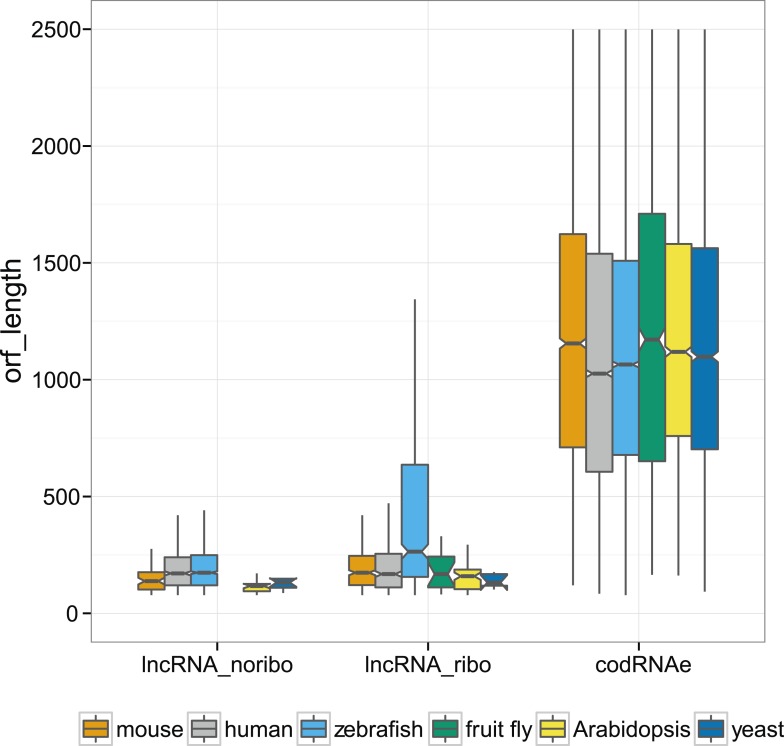
Figure 5—figure supplement 1. Absolute nucleotide length of ORFs in different kinds of transcripts.

Figure 5—figure supplement 1.

In codRNAs and lncRNA_ribo, we selected the primary ORF (the ORF with the largest number of ribosome profiling reads), whereas in lncRNA_noribo we selected the longest ORF.
Figure 5—figure supplement 2. Translational efficiency in single-isoform genes.

Figure 5—figure supplement 2.

(A) Box-plots of TE distribution in primary ORF, 5′UTR, and 3′UTR regions. The analysis considered only genes with one isoform, with UTR and ORF regions expressed at >0.2 FPKM and with 5′UTR and 3′UTR longer than 30 nucleotides. The number of transcripts was 980 codRNA and 97 lncRNA_ribo in mouse, 758 codRNA and 36 lncRNA_ribo in human, 3763 codRNA and 117 lncRNA_ribo in zebrafish, and 1495 codRNA and 32 lncRNA_ribo in Arabidopsis. (B) Box-plots of TE distribution in primary ORFs, other ORFs with ribosome profiling reads and non-ORF regions (interORFs). The analysis only considered genes with one isoform in which these regions were longer than 30 nucleotides and with expression >0.2 FPKM. The number of transcripts was 1691 codRNA and 113 lncRNA_ribo in mouse, 763 codRNA and 54 lncRNA_ribo in human, 1170 codRNA and 108 lncRNA_ribo in zebrafish, and 817 codRNA and 25 lncRNA_ribo in Arabidopsis.
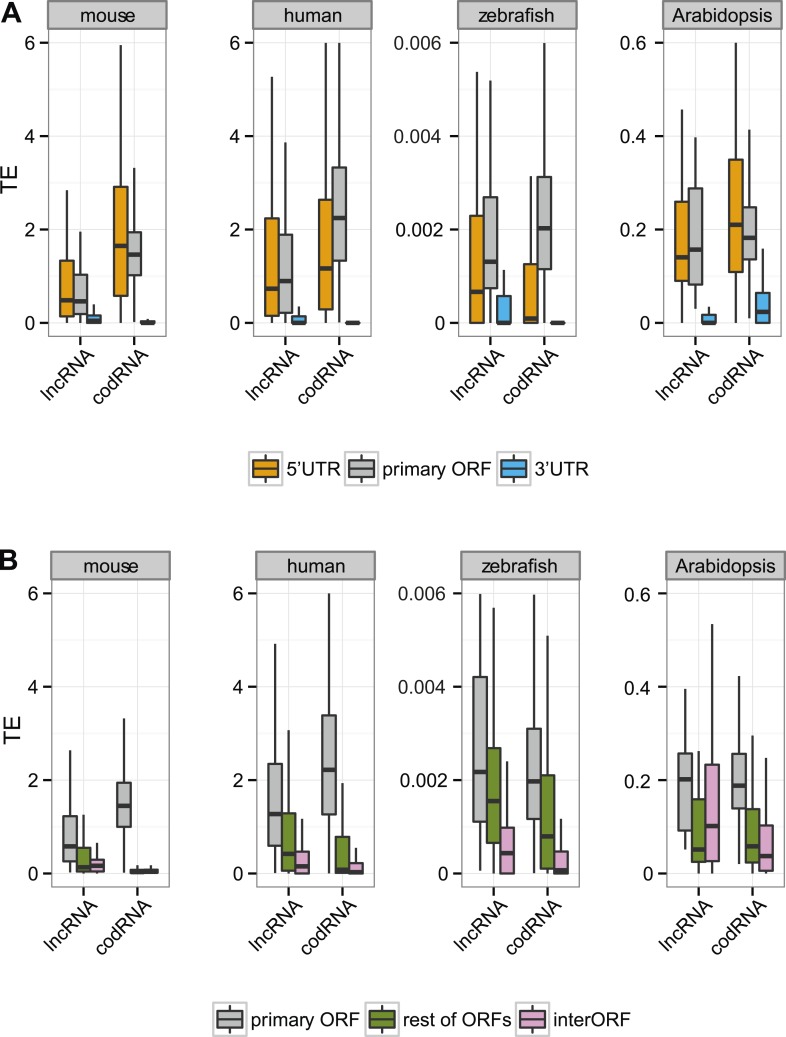
Figure 5—figure supplement 3. Translational efficiency in annotated transcripts.

Figure 5—figure supplement 3.

(A) Box-plots of TE distribution in primary ORF, 5′UTR, and 3′UTR regions. The analysis considered only annotated transcripts, with UTR and ORF regions expressed at >0.2 FPKM and with 5′UTR and 3′UTR longer than 30 nucleotides. The number of transcripts was 1956 codRNA and 92 lncRNA_ribo in mouse, 3558 codRNA and 138 lncRNA_ribo in human, 5216 codRNA and 54 lncRNA_ribo in zebrafish, and 2019 codRNA and 22 lncRNA_ribo in Arabidopsis. (B) Box-plots of TE distribution in primary ORFs, other ORFs with ribosome profiling reads (rest ORFs) and non-ORF regions (interORF). The analysis only considered annotated transcripts in which these regions were longer than 30 nucleotides and with expression >0.2 FPKM. The number of transcripts was 3264 codRNA and 128 lncRNA_ribo in mouse, 3104 codRNA and 167 lncRNA_ribo in human, 1646 codRNA and 58 lncRNA_ribo in zebrafish, and 1098 codRNA and 18 lncRNA_ribo in Arabidopsis.
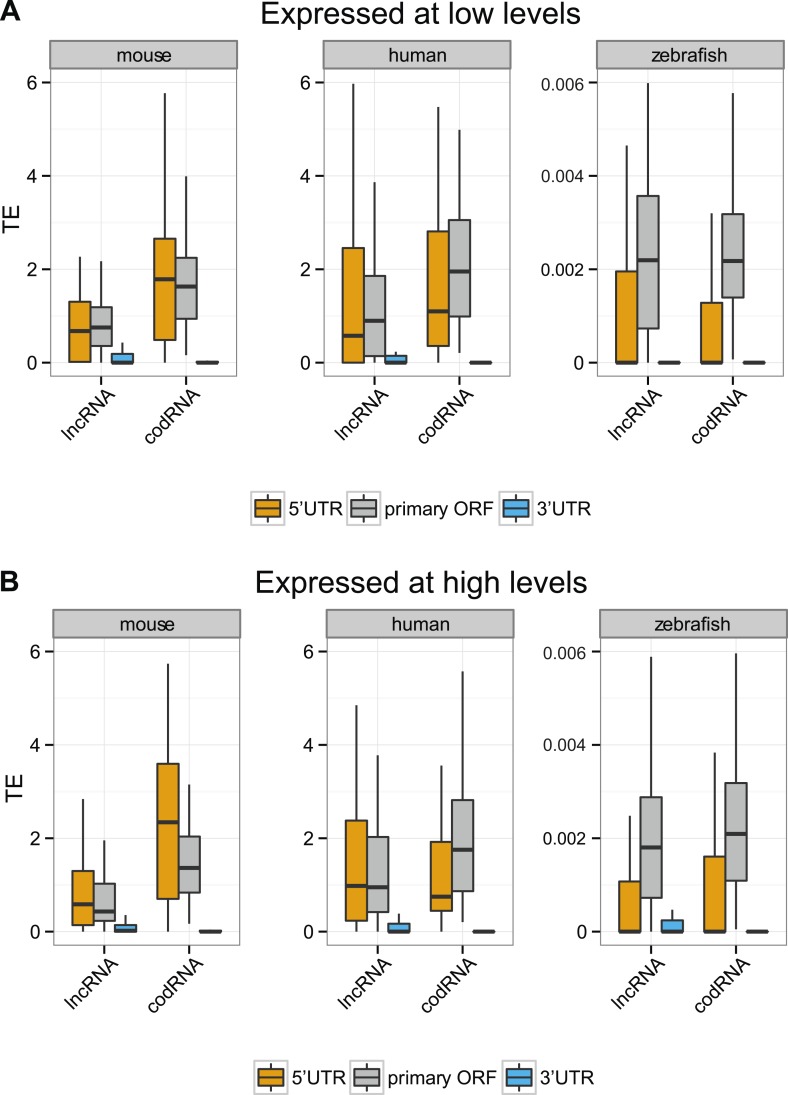
Figure 5—figure supplement 4. Translational efficiency in transcripts expressed at different levels.

Figure 5—figure supplement 4.

We restricted this analysis to transcripts with ORF and UTR regions expressed at >0.2 FPKM and with 5′UTR and 3′UTR longer than 30 nucleotides. (A) Expressed at low levels: transcripts expressed at 0.5–2 FPKM, (B) expressed at high levels: transcripts expressed at 2–10 FPKM. codRNAs were sampled in such a way as to have the same gene expression distribution as the corresponding lncRNA set. Results for species in which all sets contained at least 20 transcripts are shown.