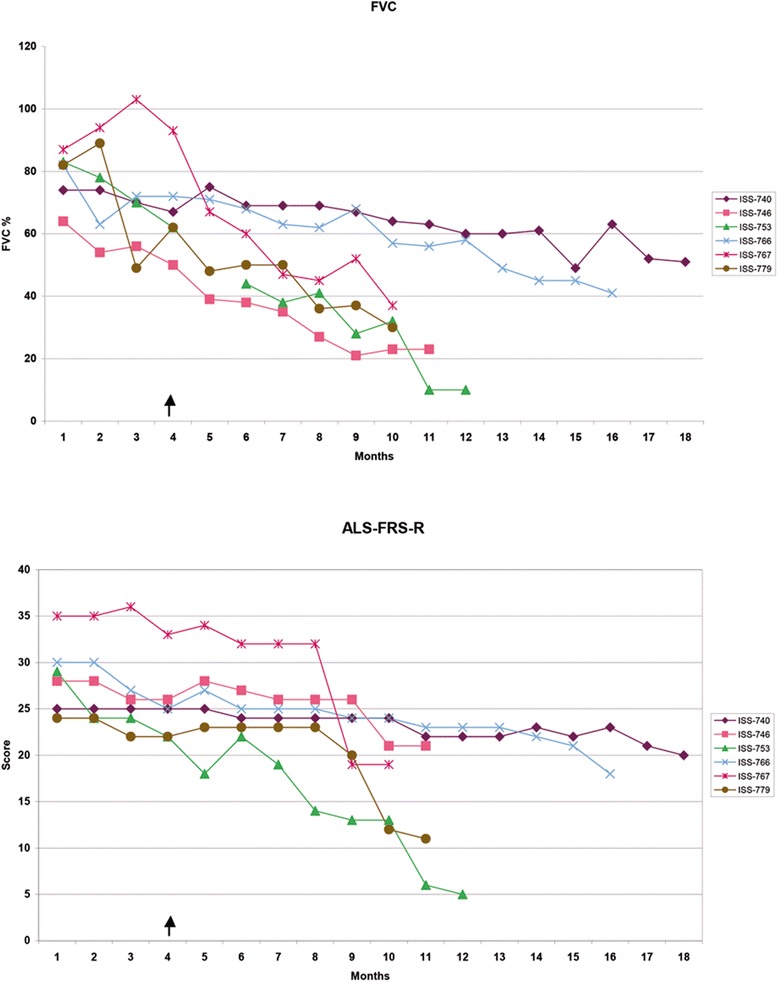
Figure 7.

Clinical follow-up. Changes of the Forced Vital Capacity (upper panel) and of the ALS-FRS score (lower panel) in the 3-month period of natural history observation and after transplantation. The arrow indicates the time of NSCs transplantation.
