
Figure 1.
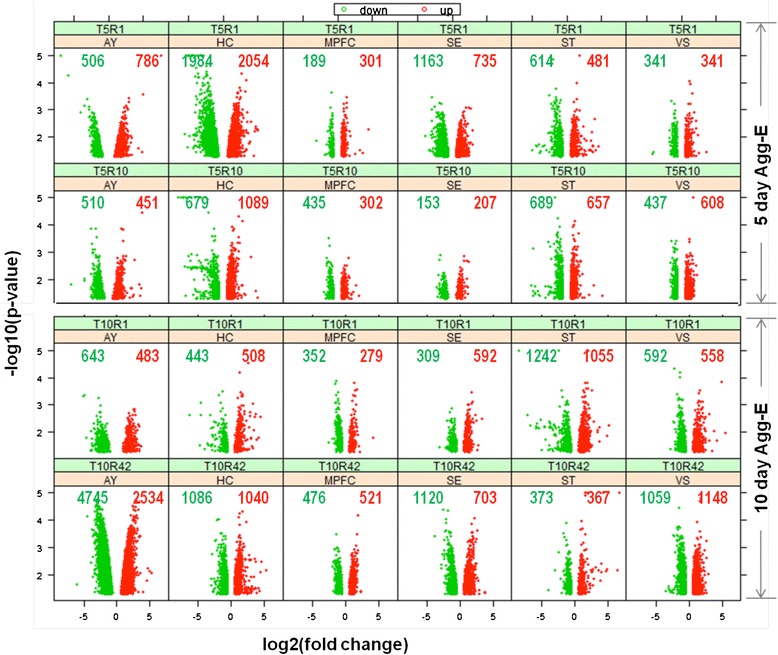
Differentially expressed genes (DEGs) across brain regions at different time points (T5R1, T5R10, T10R1 and T10R42). The scatter plots show both log2 -fold changes and negative log10 p-values in six brain regions (across) and four time-points (down); the numbers of up- and down-regulated transcripts in each group are also shown. Key: amygdala (AY), hippocampus (HC), medial prefrontal cortex (MPFC), septal region (SE), corpus striatum (ST), and ventral striatum (VS), T: number of days of trauma or aggressor exposure; R: post-trauma tissue collection days; Agg-E: aggressor-exposed.