
Figure 8.
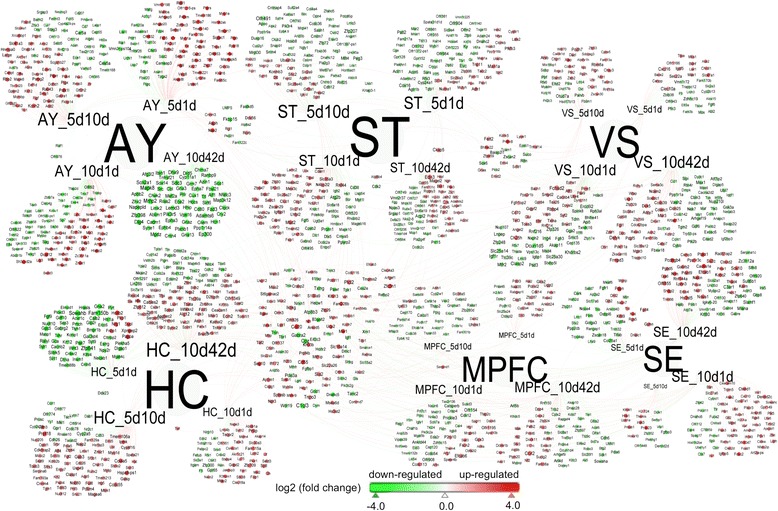
Transcripts – brain-regions interactome for transcripts that passed p-value less than 0.01 and fold change greater than 2.0 in Agg-E groups compared to control groups (across time points).
Official websites use .gov
A
.gov website belongs to an official
government organization in the United States.
Secure .gov websites use HTTPS
A lock (
) or https:// means you've safely
connected to the .gov website. Share sensitive
information only on official, secure websites.
Transcripts – brain-regions interactome for transcripts that passed p-value less than 0.01 and fold change greater than 2.0 in Agg-E groups compared to control groups (across time points).