
Figure 4.
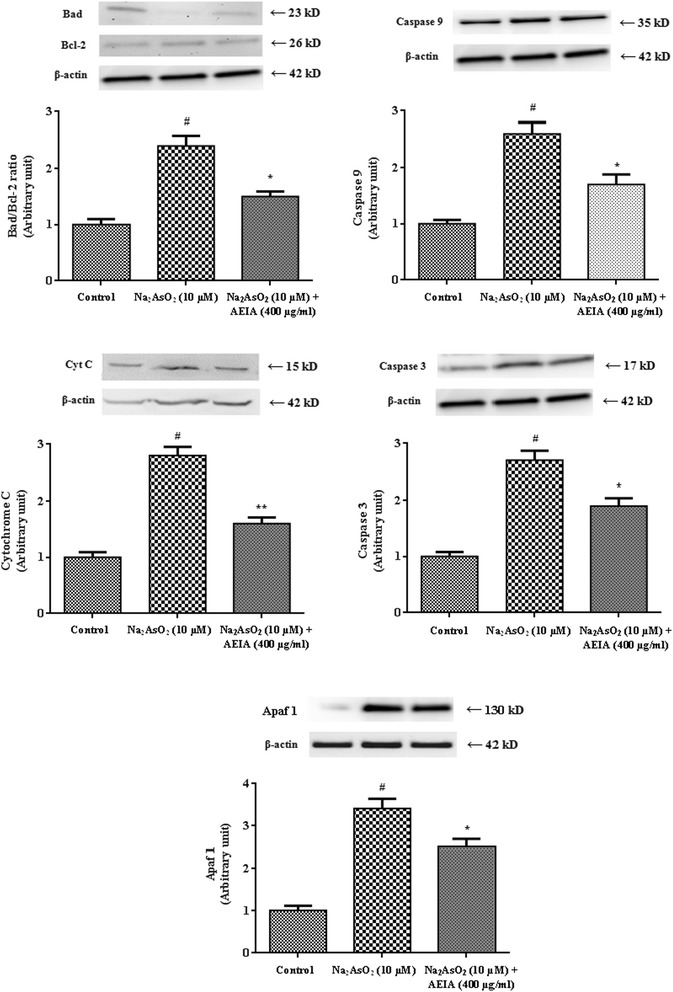
Respective western blot analysis of Bad, Bcl-2, cyt-C, caspase 9, caspase 3 and Apaf 1 in absence (NaAsO 2 ) and presence of AEIA (NaAsO 2 + AEIA) in isolated murine hepatocytes. The relative band intensities were measured and the normal control band was given an arbitrary value of 1. β-actin was used as a loading protein. Values were expressed as mean ± SE (n = 3). #Values differed significantly (p < 0.01) from normal control. *Values differed significantly (p < 0.05) from NaAsO2 control. **Values differed significantly (p < 0.01) from NaAsO2 control.