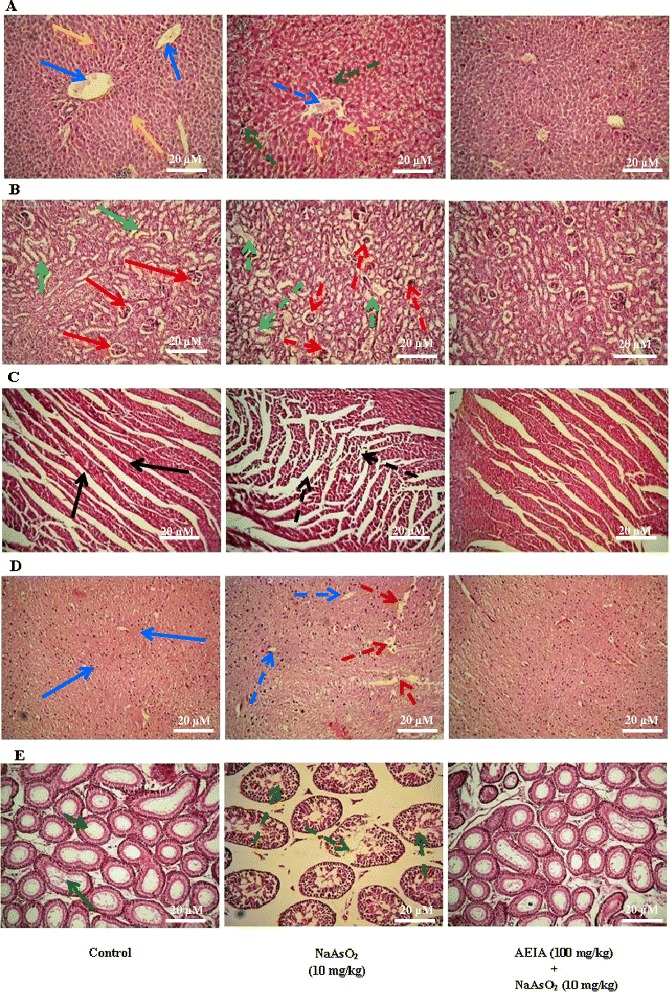
Figure 8.

Histological sections of different tested organs of experimental mice in absence (NaAsO 2 ) and presence of AEIA (NaAsO 2 + AEIA). Untreated mice were kept as control to compare the structural changes caused by NaAsO2. Panel A. Histogram of liver sections; blue and yellow arrows represent normal portal vein and hepatocytes, respectively; dotted arrows represent the NaAsO2 mediated structural changes of portal vein (blue) and hepatocytes (yellow) with infiltrating leukocytes (green). Panel B. Histogram of kidney sections; red and green arrows represent normal glomerulus structure and renal tubules, respectively; dotted arrows represent the NaAsO2 mediated glomerular hypercellularity (red) and cloudy swelling of renal tubules (green). Panel C. Histogram of heart sections; black arrows indicated normal radiating pattern of cardiac muscle; black dotted arrows showed extensive degeneration in cardiac muscle during As-intoxication. Panel D. Histogram of brain sections; blue arrows represent normal normal cyto-architecture of brain; dotted arrows represent the NaAsO2 mediated development of vacuolated area of degenerated tissues (red) and diffused edema (blue). Panel E. Histogram of testes sections; green arrows represent normal seminiferous tubules; green dotted arrows represent NaAsO2 mediated marked degeneration in the seminiferous tubules in testes section.
