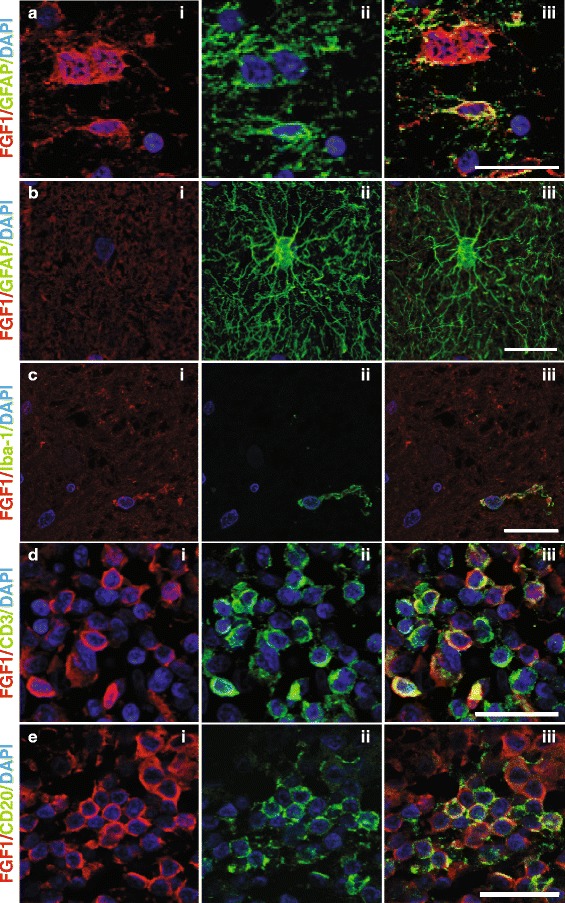
Figure 4.

FGF1 is displayed by astrocytes, microglia/macrophages and lymphocytes. Double immunofluorescence staining of FGF1 with GFAP (a, b), Iba-1 (c), CD3 (d), and CD20 (e). Pictures were taken from different areas, namely a chronic inactive demyelinated lesion (a), NAWM (b), chronic active lesion (c), and perivascular cuffs in an active lesion (d, e). Scale bars: a and b 12.5 μm; (c, d) and (e) 25 μm.
