Figure 8.

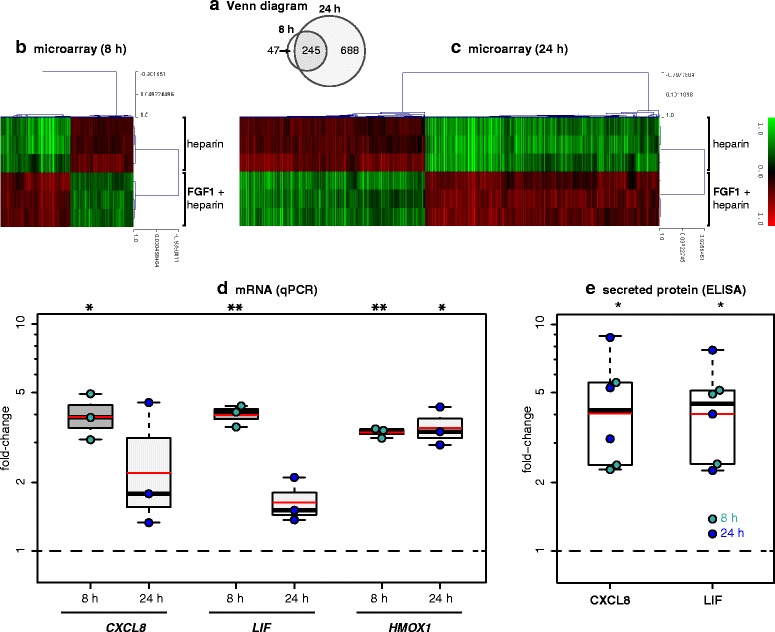
FGF1-induced gene expression in human primary astrocytes. (a-c) Gene expression was analysed after 8 h (a,b) and 24 h (a,c) with and without FGF1 (10 ng/ml). In all experiments, FGF1 was applied together with heparin (5 U/ml); control cultures contained heparin only. Only differentially expressed probes (corrected p-value <0.05, fold-change > 1.4-fold up or down, and normalized mean expression intensity ≥ 100 in any one of the two groups) are shown. The number of differentially expressed probes is shown in (a). CXCL8 and LIF were among the genes upregulated at both time points (see also Additional file 5: Table S3). (d) For validation, the gene expression of CXCL8, LIF, and the positive control HMOX1 were analysed by qPCR after 8 h and 24 h with FGF1 (10 ng/ml). (e) Secreted CXCL8 and LIF protein were measured by ELISA in the supernatant after 8 and 24 h with and without 10 ng/ml FGF1. In (d,e), the fold-change compared to unstimulated control cultures is displayed. Black bars and boxes indicate medians and 1st/3rd quartiles, respectively. Whiskers extend to the most extreme samples up to 1.5× of the IQR. Red bars indicate means. Fold-changes were analysed by two-sided one-sample tests against the control samples (μ = 1; t-test for FGF1 mRNA, U test for FGF1 protein because of non-normal distribution). *: p < 0.05, **: p < 0.01.
