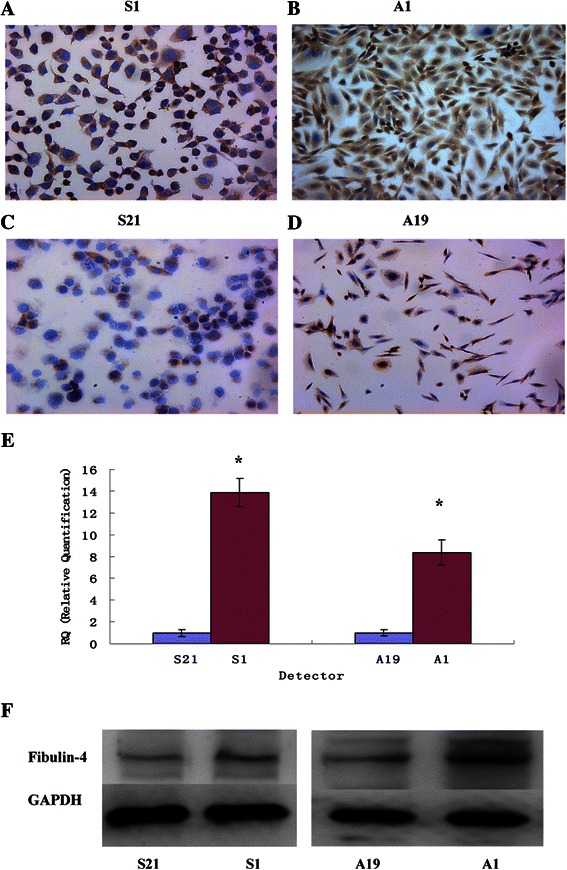
Figure 3.

Fibulin-4 expressions in highly invasive subclones and low invasive subclones. (ABCD) Fibulin-4 protein expressions of highly invasive subclones S1 (A) and A1 (B) and low invasive subclones S21 (C) and A19 (D) as measured by ICC staining (Magnification × 200). (E) Fibulin-4 mRNA expressions of highly invasive subclones and low invasive subclones as measured by q-RT-PCR. (F) Fibulin-4 protein expressions of highly invasive subclones and low invasive subclones as measured by Western blot. *P < 0.05 versus control.
