
Figure 1.
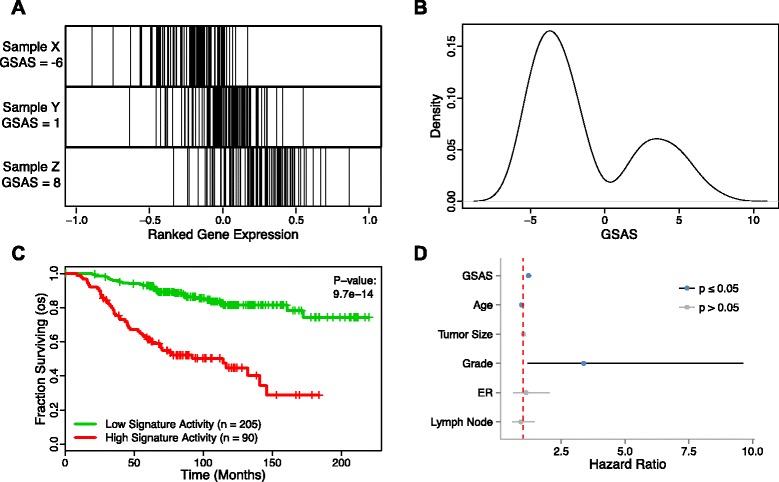
The GSAS of VANTVEER_BREAST_CANCER_METASTASIS_DN predicts patient survival. (A) The distribution of genes from this gene set in an expression-ranked gene list in samples with a low (Sample X), intermediate (Sample Y), and high (Sample Z) GSAS. (B) The distribution of GSASs across all samples in a dataset. (C) Patients with positive GSASs (red curve) show significantly shorter survival times than those with negative GSASs (green curve). Vertical hash marks indicate points of censored data. (D) In a Cox PH model, this GSAS significantly predicts patient survival even after adjusting for traditional clinical features. A red dotted line indicates where the hazard ratio = 1.