Figure 1.

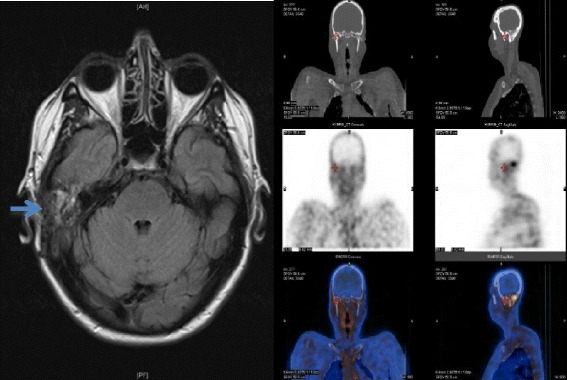
MRI scan - T2 weighted image showing soft tissue oedema in the region of the right mastoid (left-see arrow) and technetium 99 m scan showing increased uptake in the same area (right).

MRI scan - T2 weighted image showing soft tissue oedema in the region of the right mastoid (left-see arrow) and technetium 99 m scan showing increased uptake in the same area (right).