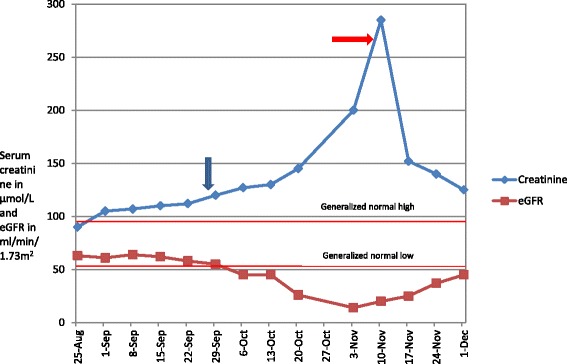
Figure 2.

Temporal trend in the creatinine and eGFR of our patient (from 1 st admission till most recent follow up). Note- the two lines ‘generalized high’ and ‘generalized low’ depict the values of serum creatinine. Blue arrow-Cefepime start date -28/9, red arrow Cefepime stop date -5/11.
