Figure 1.

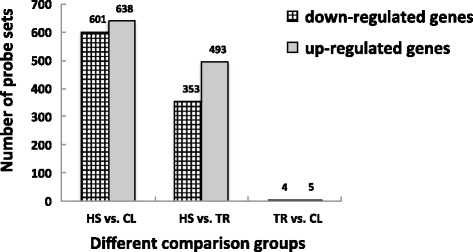
The number of differentially expressed genes in three different comparison groups. Note: FDR < 0.05 and fold change ≥ 1.5; HS: heat stress group; CL: control group; TR: temperature recovery group.

The number of differentially expressed genes in three different comparison groups. Note: FDR < 0.05 and fold change ≥ 1.5; HS: heat stress group; CL: control group; TR: temperature recovery group.