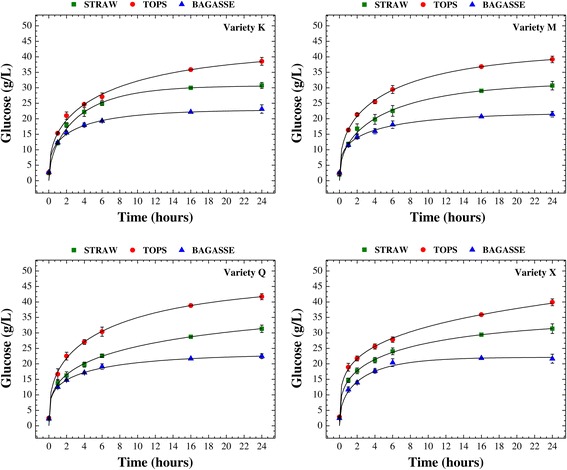
Figure 1.

Temporal profiles of glucose release. Temporal profiles of glucose release during the enzymatic hydrolysis of bagasse, straw, and tops from different varieties of sugarcane (K, M, Q, and X) pretreated with dilute sulfuric acid. The lines are models fitted according to the Chrastil [61] approach.
