
Figure 2.
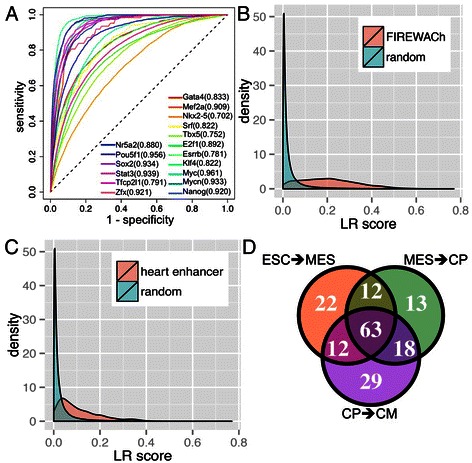
Stage specific transcription factor (TF) binding probability (LR score). (A) Performance of leave-one-TF-out cross-validation of predicting binding sites of 12 ESC TFs and 5 cardiac TFs, as measured by area under the Receiver Operating Characteristics curve (AUC). (B) Distribution of the mean LR score of ESC transcriptional regulatory modules identified by functional identification of regulatory elements within accessible chromatin (FIREWACh) and the LR score of one million randomly selected bases in the cis-region [35]. (C) Distribution of the mean LR score of heart enhancers and the LR score of one million randomly selected bases in the respective cis-regions [34]. (D) Number of significantly enriched TFs in high LR score regions (>0.1) in the three stage transition.