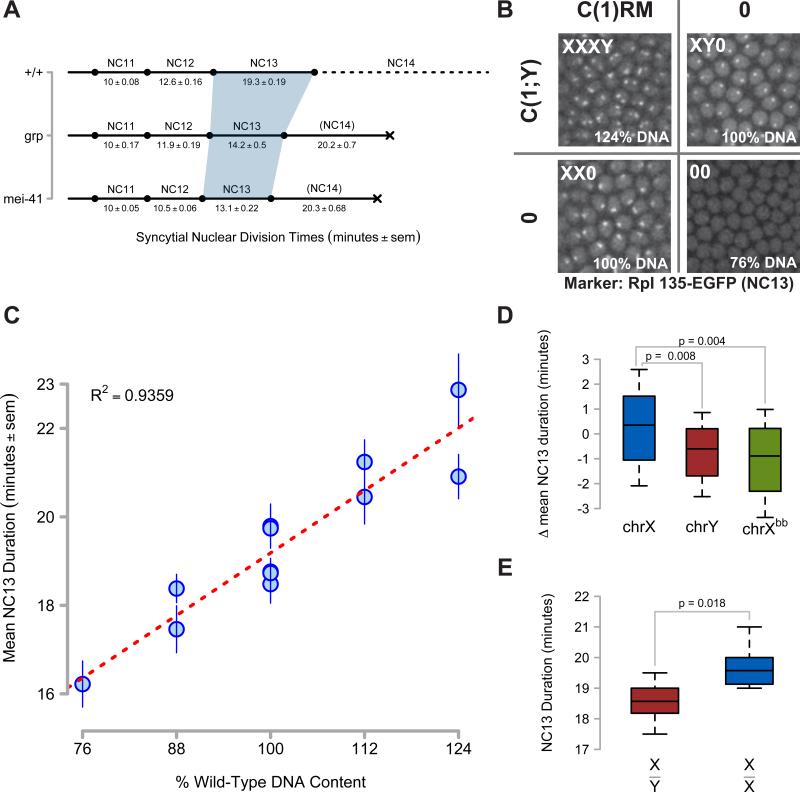
Figure 1. Non-Equivalence of Zygotic DNA for MBT Checkpoint Activation.
(A) Timelines of syncytial cell cycle times for wild type (+/+), grp1, and mei-41D3/29D embryos were measured by time-lapse confocal microscopy of H2Av-GFP or RFP. The shaded region highlights NC13. Lethality is signified by a black X.
(B) Representative confocal images (2500μm2) of nucleolar RNA Pol I GFP expression in NC13 embryos produced from a cross between C(1)RM/0 ; RpI135-EGFP/+ and C(1;Y)1/0 adults. First chromosome dosage is indicated in the upper left of each panel, and the corresponding amount of zygotic genomic DNA is indicated in the bottom left. NC13 nucleolar morphology in XY0 embryos is punctate, whereas it is barbell-shaped in XX0 embryos (See Supplemental Information). No nucleolar RpI135 EGFP is detected at NC13 in 00 embryos.
(C) NC13 times were measured for embryos with zygotic DNA dosage between 76% and 124% (see Experimental Procedures). Mean NC13 times ± sem for N ≥ 11 embryos per genotype are plotted as a function of zygotic genomic DNA content. Linear regression is represented as a red line.
(D) Box plots showing deviations from mean NC13 time for genotypes differing in chrX (N = 74), chrY (N = 40), or rDNA dosage (Xbb, N = 41). Brackets indicate the results of two-tailed t-tests.
(E) NC13 times for male (X/Y, N = 11) and female (X/X, N = 12) embryos produced from w; His2Av-RFP x w, HbP2>GFPnls /Y; + adults. Box plots show the distribution of NC13 times for each genotype. Brackets indicate the results of a two-tailed t-test.
See also Figure S1.

