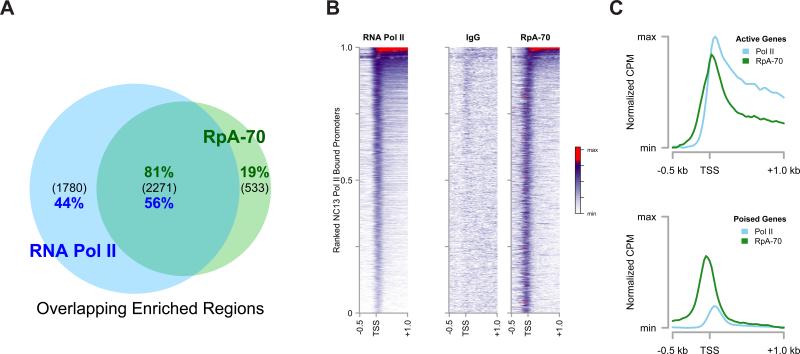
Figure 5. RpA-70 EGFP Co-Localizes with RNA Pol II in NC13 Embryos.
(A) Genomic regions significantly enriched by ChIP-seq for RpA-70 or Pol II were identified and intersected to yield a set of co-enriched regions. The total number of peaks in each group is indicated in parenthesis and the percentage of the total for each ChIP is shown (green: RpA-70, blue: Pol II).
(B and C) Promoter-by-promoter view of Pol II and RpA-70 localization on NC13 chromatin is shown (B) compared with a control ChIP (IgG). The mean distribution of Pol II and RpA-70 over actively expressed (C, top) and poised (C, bottom) is plotted. To facilitate comparison, mean CPM values per set of co-enriched promoters for each ChIP were calculated and are presented normalized to the maximal value per ChIP and are then floored to the minimum value (Normalized CPM).

