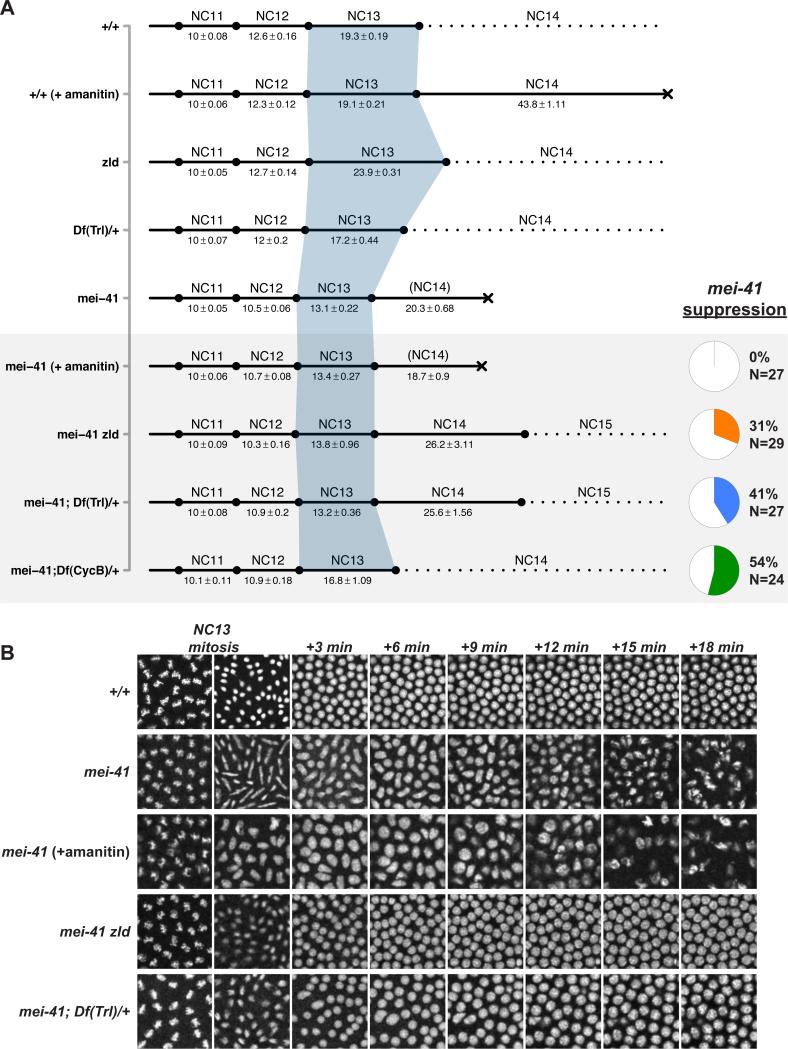
Figure 7. Reduced Pol II recruitment suppresses mei-41 lethality.
(A) Syncytial cell cycle times for the indicated genotypes/treatments were measured by time-lapse confocal microscopy of H2Av-GFP. Time is represented in minutes ± sem. Lethality is represented by a black X. The grey box highlights conditions tested for suppression of mei-41 lethality. Data for suppressing individuals only are shown for the final three genotypes. The pie charts at bottom right indicate the frequency of mei-41 suppression for the associated genotypes. Wild-type and mei-41 data is reproduced from Figure 1. N = 27 (+/+ (+amanitin)), N = 30 (zld germline clones), N = 20 (Df(Trl)/+).
(B) Representative images (2500μm2) from time-lapse recordings from (A) are shown in 3-minute intervals beginning at metaphase 13 through 18 minutes into NC14. Note the absence of defective NC13 mitosis in mei-41 zld and mei-41; Df(Trl)/+ and subsequent wild-type nuclear morphology compared with mei-41 alone or mei-41 (+amanitin).

