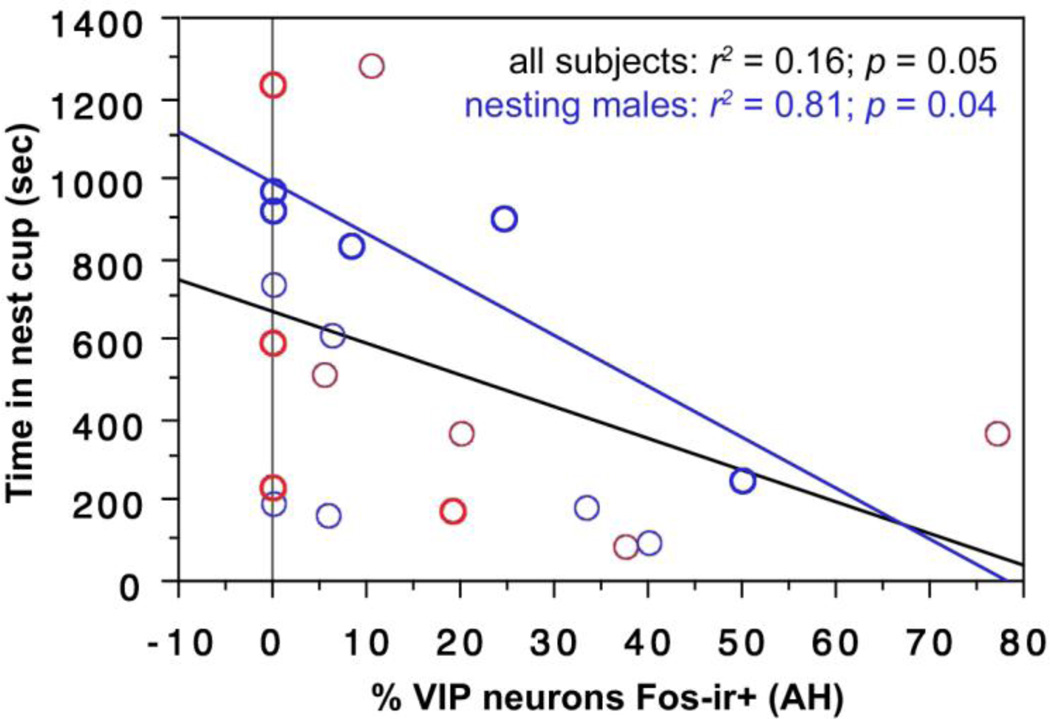
Fig. 8.
VIP-Fos colocalization (% of VIP neurons co-expressing Fos) in the AH correlates negatively with the amount of time spent in the nest cup by all subjects (black regression line) and by nesting males alone (blue regression line). Males are shown in blue; females in red. Data points from nesting subjects are shown in heavy circles; data points from subjects with nest cups only are shown in lighter circles.

