
Figure 1.
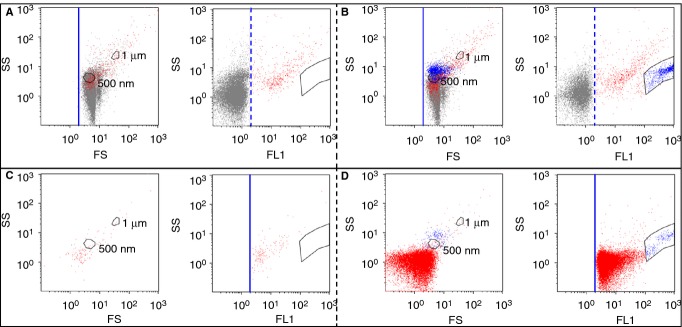
Flow cytometry (FCM) analysis of a platelet-free plasma (PFP) sample by FS triggering (A,B) and FL triggering (C,D), in the absence of Ca2+ (A, C) and in the presence of Ca2+ (B, D). (A-D). Each of the four panels presents on the left an FS vs. SS color dot plot and on the right an FL1 vs. SS color dot plot. Thresholds are represented by a solid blue line, while fluorescence positivity gates are represented by a dashed blue line. The positions of 500-nm and 1-μm polystyrene particles are indicated in each FS vs. SS plot (Fig. S2). (A,B) FS triggering analysis. The acquisition time was 10 min. Events labeled with Anx5-Fluo are separated into two groups: events of high fluorescence intensity forming a well-defined cluster are colored blue, and all the other Anx5-positive events are colored red. (C,D) FL triggering analysis. The acquisition time was 1 min, which explains why the cluster of erythrocyte ghosts (colored blue) contains less events than in (B).