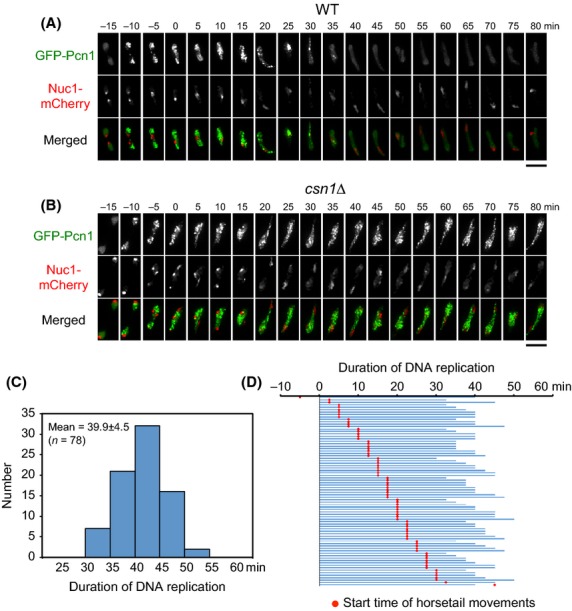
Figure 2.

Time-lapse imaging of GFP-Pcn1 during meiosis. (A, B) Dynamics of GFP-Pcn1 (green) and Nuc1-mCherry (red) in wild-type cells (A) and csn1Δ (B) cells. Numbers indicate the time in minutes after the beginning of horsetail nuclear movements. Scale bars represent 5 μm. (C) Histogram of duration of DNA replication measured in 78 cells. (D) Start time of the horsetail movements (red spot) relative to the duration of DNA replication (blue line) for each of the 78 cells.
