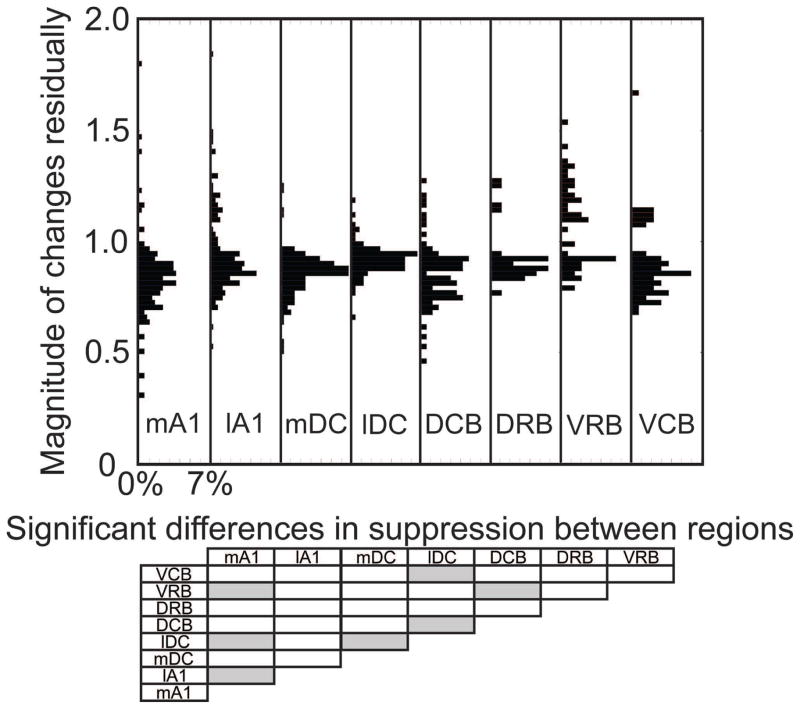
Figure 10. Magnitude of residual changes in CNIC responses caused by PN-Stim for different AC regions.
In the top panel, the residual change in spike count after PN-Stim compared to the baseline response to acoustic stimulation is plotted for the AC-CNIC site pairs that were significantly suppressed or facilitated based on the cortical region stimulated. Percentages are relative to the total number of AC-CNIC site pairs for each cortical region. The bottom panel shows which cortical regions are statistically different from the others (gray boxes) based on the magnitude of residual changes in suppressed responses using a Bonferroni-adjusted t statistic multiple comparison test with p<0.01. None of the cortical regions are statistically different when comparing the magnitude of residual changes in facilitatory responses.

